Categorization of battleground states in this report
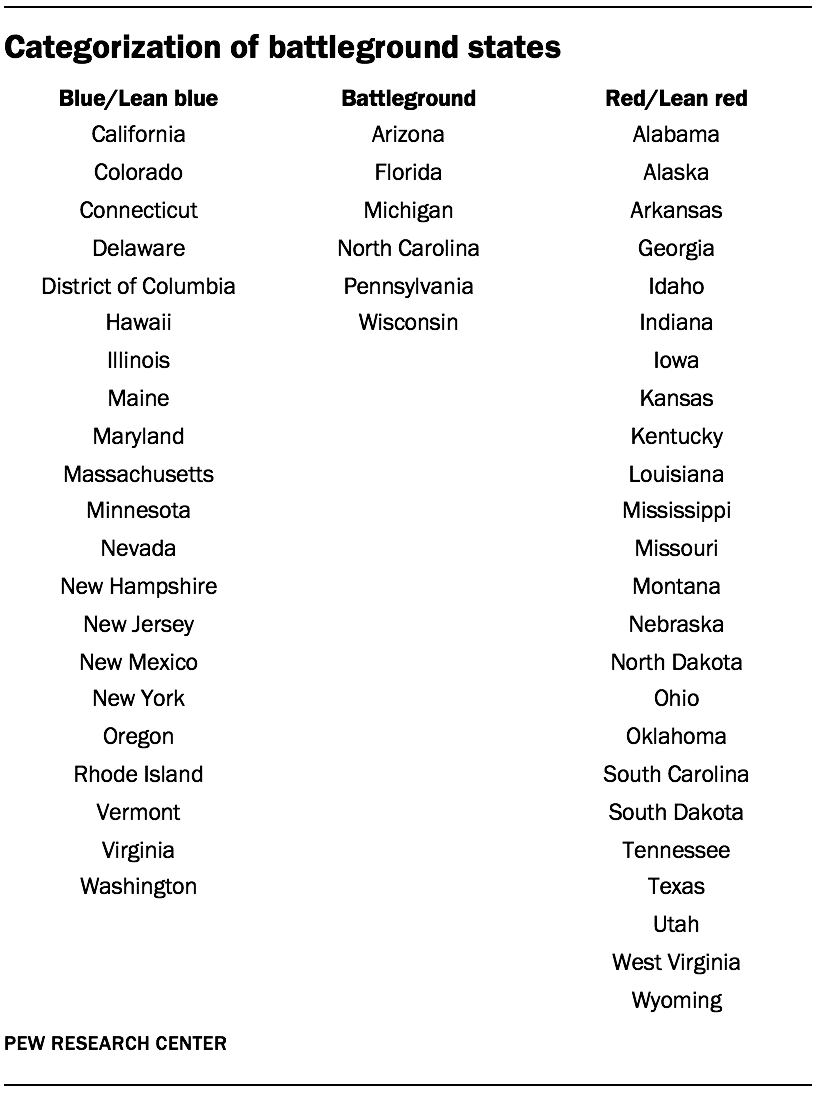
To identify battleground states for the November presidential election, researchers consulted several experts’ forecasts (including Larry Sabato’s Crystal Ball, the Cook Political Report, Inside Elections and Nate Cohn’s New York Times ratings) to come up with a categorization of each state as either likely to back the Democrat (Blue/lean blue), likely to back the Republican (Red/lean Red), or a “battleground state.” The specific states in each category can be found in the accompanying table.
Categorization of COVID-19 county health impact in this report
This report uses the number of deaths attributed to COVID-19 in each respondent’s county as a measure of the scale of the health impact of the outbreak for each individual in the survey. These numbers are then adjusted for differences in county population (per 100,000 residents). Counties are categorized as having a high, medium or low rate of COVID-19 deaths.
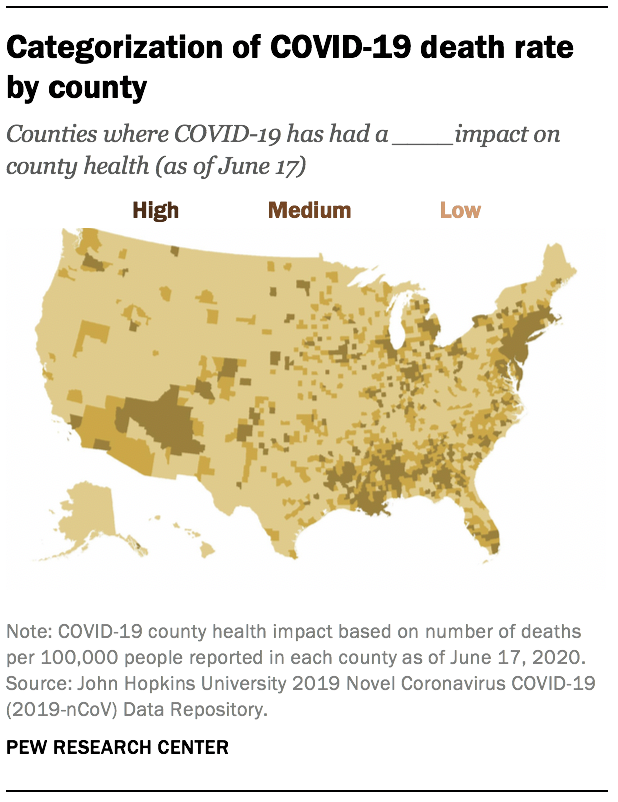
Counties are classified as “high” if they had 28 or more deaths per 100,000 people as of June 17, 2020. “Low” counties had fewer than seven deaths per 100,000 people. The remaining counties are classified as “medium” impact.
Data for deaths attributed to COVID-19 by county are taken from the 2019 Novel Coronavirus COVID-19 (2019-nCoV) Data Repository maintained at John Hopkins University (downloaded on June 19, 2020).
© Pew Research Center, 2020


