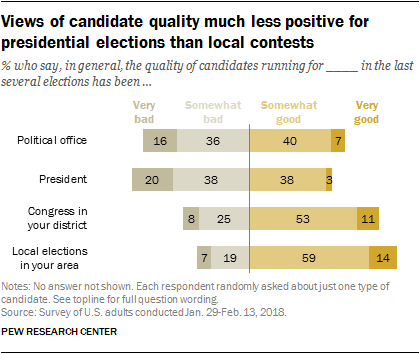
 In general, Americans have low regard for elected officials. And when asked about candidates running for office in the last several elections, only about half (47%) say the quality of candidates overall has been good, with just 7% saying they have been “very good”; about as many (52%) take a negative view.
Yet the public makes clear distinctions in evaluations of candidate quality, depending on whether they are running for president, Congress or a local office.
Ratings of the field of presidential candidates in recent elections are similar to ratings of generic candidates for political office: 41% rate the quality of recent presidential candidates at least somewhat good (just 3% say very good), while 58% say they have generally been bad.
But the public offers more positive views of those running for offices closer to home: 64% say the quality of candidates running for Congress in the last several elections in their district has generally been at least somewhat good, while nearly three-quarters (73%) rate candidate quality in local elections (such as for mayor or county government) positively.
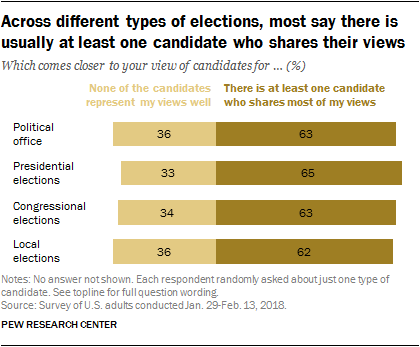 Across different types of elections, about six-in-ten Americans say that they “usually feel like there is at least one candidate who shares most of my views.”
When asked generally about candidates for political office, 63% of Americans say there is usually at least one candidate who shares their views. That figure does not vary much when they are asked about specific offices: 65% say at least one presidential candidate usually represents most of their views, and 63% say the same about congressional candidates and 62% about candidates for local political office.
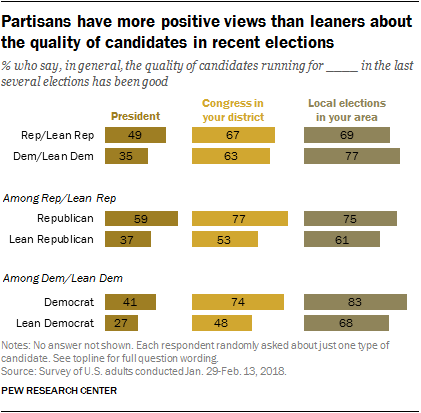 Overall, Republicans and Republican-leaning independents are more likely than Democrats and Democratic leaners to say the quality of candidates running for president has been good in recent years (49% vs. 35%). Conversely, Democrats are more likely than Republicans to rate their recent slates of local candidates positively (77% vs. 69%). Partisans view their recent congressional candidates similarly (67% of Republicans and Republican leaners say they have been good, compared with 63% of Democrats and Democratic leaners).
Within both partisan coalitions, however, those who identify with the party are significantly more likely than those who do not (and instead “lean” to the party) to view the quality of recent candidates positively. This pattern is evident across presidential, congressional and local contests.
For example, while 77% of those who identify as Republicans say that the quality of candidates running for Congress in their district has been at least somewhat good in recent elections, just 53% of those who lean toward the Republican Party say the same. There is a similar gap between Democrats (74%) and Democratic leaners (48%).
Partisan identifiers also are more likely than independents to say that in these types of elections they usually feel that at least one candidate represents their views. Asked about candidates for political office generally, about seven-in-ten Republicans (71%) and Democrats (73%) say this; by comparison, 61% of Republican-leaning independents and 49% of Democratic-leaning independents say the same.
Evaluations of the congressional candidate field vary based on the degree to which partisans “fit” the partisan cast of their district. For instance, among Republicans and Republican leaners who live in districts that have voted for Republican congressional candidates by wide margins in recent elections, about eight-in-ten (78%) say the quality of candidates in their district is good. Among those who live in more politically mixed (“swing”) districts, 73% say this, as do just 50% of Republicans who live in overwhelmingly Democratic districts.
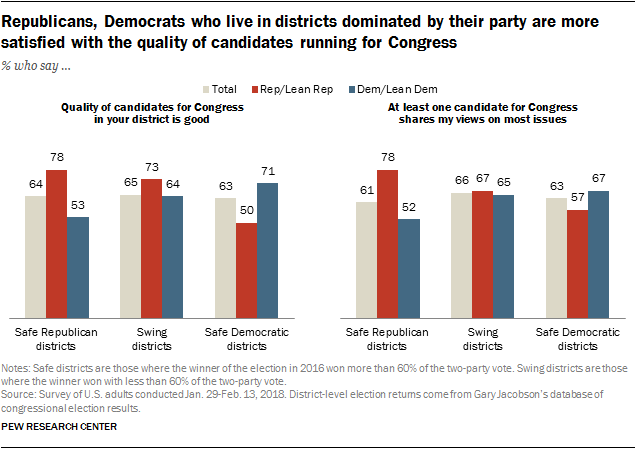 Among Democrats there is a similar, if less dramatic, pattern. About seven-in-ten (71%) living in heavily Democratic districts say the quality of candidates running in their districts is good, compared with 64% of Democrats who live in swing districts and 53% who live in predominantly Republican districts.
Nearly identical patterns are evident in reports of whether or not people think at least one candidate in congressional elections in their district shares their values.
Expectations about the responsiveness of elected officials
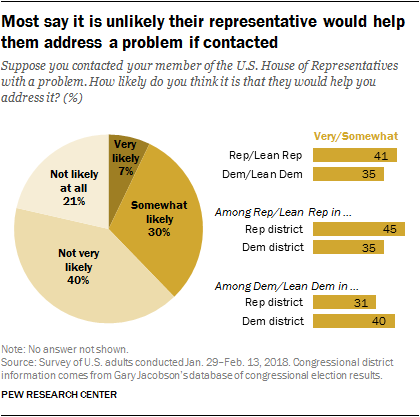 About six-in-ten Americans say that if they contacted their member of the U.S. House of Representatives with a problem it is either not very likely (40%) or not likely at all (21%) they would get help addressing it. Just 7% say their representative would be very likely to help, while 30% say this would be somewhat likely.
Overall, Republicans are somewhat more likely than Democrats to say that their congressional representative would be at least somewhat likely to help them address an issue (41% of Republicans vs. 35% of Democrats).
But these perceptions vary across districts. In both parties, those who live in districts represented by a member of their same party are more likely to anticipate that their member of Congress would help them with a problem. For instance, while 35% of Republicans living in districts represented by Democrats say they would expect assistance, that rises to 45% among Republicans living in districts with a GOP representative. Similarly, Democrats who live in districts represented by a Democrat are more likely than Democrats in districts represented by Republicans to say their congressional representative would respond if contacted (40% to 31%, respectively).
Overall, adults who are politically engaged are more likely than those who are less engaged to expect that their representative would address an issue if contacted. This pattern holds true controlling for both partisanship and the partisanship of the district’s representative.
What should happen when the majority and a governor’s supporters don’t agree?
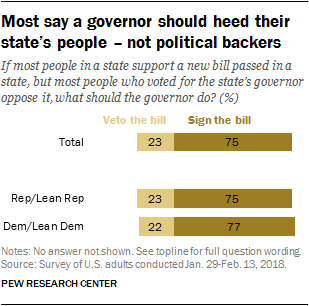 Three-quarters of Americans (75%) say that when a new bill is supported by a majority of people in a state – but opposed by the governor’s supporters – the governor should follow the will of the majority and sign the legislation. And while there are no differences between Republicans and Democrats in these views when the governor’s party is not specified, partisans’ answers do differ when the partisanship of the governor (and the governor’s supporters) is mentioned.
Using a survey experiment in which subsets of the public were presented with and without partisan descriptions of the governor and the governor’s supporters, wide majorities in every condition of the experiment support the governor signing a bill that most of the people in the state support even though the governor’s own supporters (or co-partisans) oppose the bill. (See box below for full details of the experiment.)
Majorities of both Republicans and Democrats say – in this hypothetical – that the governor should sign the bill, regardless of the partisanship assigned to the governor and the governor’s supporters. However, partisan support for going along with the majority view is substantially lower when the example provided results in their own party’s position being given less priority.
For example, when given no party reference, 75% of Republicans and Republican-leaning independents say the governor should follow the will of the majority, but when told that the governor is also a Republican and that Republicans oppose the bill, a narrower majority (66%) of Republicans say that the governor should sign the bill.
A nearly identical pattern is seen among Democrats and Democratic-leaning independents: 77% support signing in the generic case, compared with 68% when the governor and supporters are identified as Democrats.
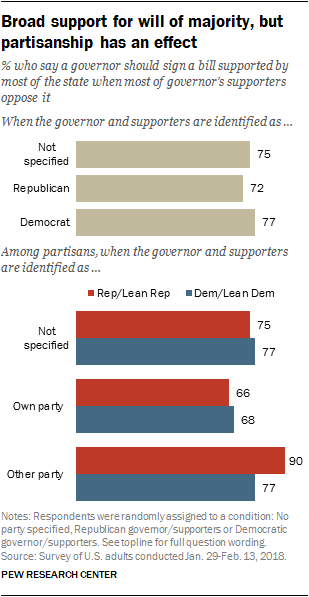 But partisans differ in their response to the example of a governor of the opposing party. Presented with an example of a bill on the desk of a Republican governor that is opposed by Republicans but supported by the majority of the state, the same share of Democrats say the governor should follow the will of the majority as say this when not provided any cues about the party of the governor or the governor’s supporters (77% in both cases).
By contrast, when Republicans are presented with a hypothetical Democratic governor, with Democrats opposed to the bill, they are substantially more likely to say that the governor should follow the will of the majority of the state rather than the governor’s supporters (90% say this) than they do in either the generic condition (75%) or when the governor and governors’ supporters are Republicans (66%).
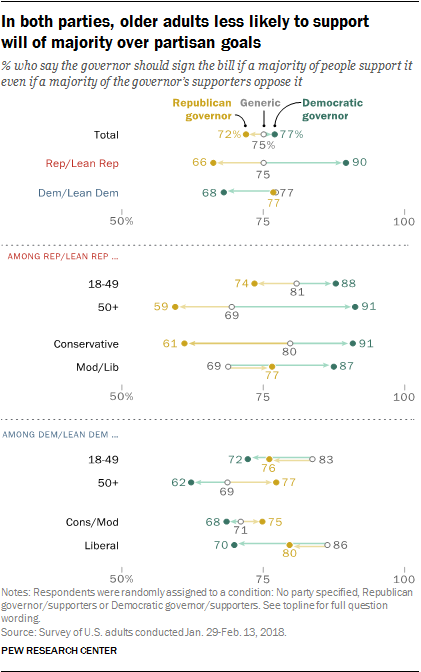 Among Republicans, the difference in the shares who say the governor should sign the legislation under different partisan conditions is particularly pronounced among older and conservative Republicans.
Older Republicans are less likely than younger Republicans to say the bill should be signed when the governor is a Republican and Republicans are in opposition (59% of those 50 and older say this, compared with 74% of those under 50). There is a similar-sized age gap in the case of a generic governor (81% vs. 69%). About nine-in-ten Republicans and Republican leaners across all age groups say the bill should be signed by a Democratic governor, even though most Democrats oppose the legislation.
A similar pattern is evident by ideology: While 77% of moderate and liberal Republicans say a bill with majority statewide support should be signed even if most Republicans in the state oppose it, that falls to 61% among conservative Republicans. There is no ideological difference among Republicans when the governor and supporters are identified as Democrats.
Among Democrats, age differences are similar to those in the GOP: Older Democrats are somewhat less likely than younger Democrats to back the signing of a bill by a Democratic governor if Democrats oppose the legislation (62% of those 50 and older, compared with 72% of those under 50) and to support the bill’s signing in the case of a generic governor and supporters (69% vs. 83%). But about three-quarters in all age groups say this when the governor is identified as a Republican.
There are no significant ideological differences among Democrats in the shares who say the governor should sign the bill in either the Republican or Democratic conditions. However, liberal Democrats are more likely than conservative or moderate Democrats to say the bill should be signed when no partisan indicators are given (86% vs. 71%).
This study includes several survey experiments that present different versions of the same question to different subsets of respondents. This experiment is designed to illustrate how people balance majority support for a policy when most members of the party of the executive oppose that policy.
Respondents were randomly assigned to one of three conditions:
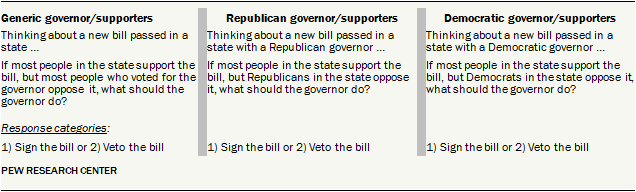
There is a fourth condition that reverses support and opposition to the generic case and is not illustrated here. Its results are inverse of the generic version; results and question wording can be found in the topline.
Only about two-in-ten say government is run for the benefit of all
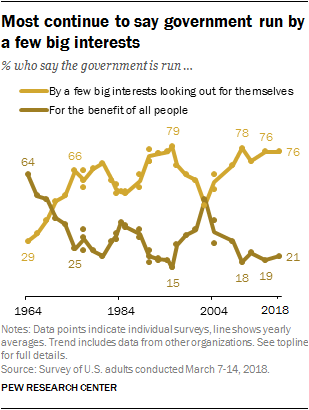 A large majority of Americans (76%) say the government is run by a few big interests looking out for themselves; fewer than a quarter (21%) say it is run for the benefit of all the people. Since the early 1970s, most Americans have generally said the government is run by a few big interests, and the share saying this is unchanged from 2015.
Most Republicans (71%) and Democrats (84%) say the government is run by a few big interests. More Democrats say this now than in 2015 (71% then vs. 84% now). Views among Republicans have moved in the opposite direction (81% then to 71% now).
Public continues to back limiting campaign spending
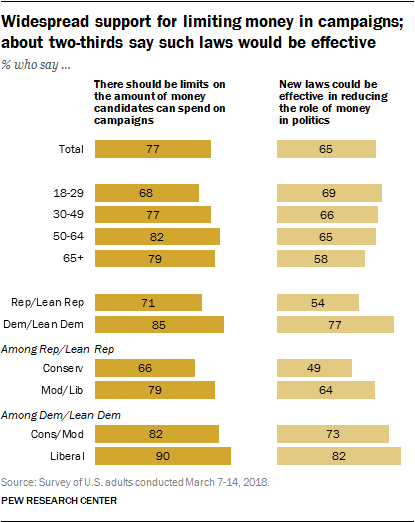 A wide majority of Americans continue to believe that there should be limits on the amount of money political candidates can spend on campaigns: Roughly three-quarters (77%) feel that such limits are appropriate. A somewhat smaller majority (65%) think that new campaign finance laws could be effective in limiting the amount of money in political campaigns. These overall views are little changed from 2015.
While majorities of Americans in all age groups endorse limiting the amount of money in political campaigns, those older than 30 are substantially more likely than younger adults to hold this view (79% of those older than 30 say that there should be limits, compared with 68% of those under 30). Conversely, while majorities in all age groups are optimistic about how effective new campaign finance laws would be in limiting the role of money in politics, that sentiment is somewhat less widespread among those 65 or older (58% say this, compared with 65% or more among younger age groups).
Though Democrats are more likely than Republicans to support limiting the amount of money in political campaigns, wide majorities in both parties say there should be limits (85% of Democrats, 71% of Republicans). Republicans are substantially more skeptical than Democrats about the effectiveness of new laws. About half (54%) of Republicans say that new laws could be effective while 77% of Democrats say the same.
Views about the public’s influence on government
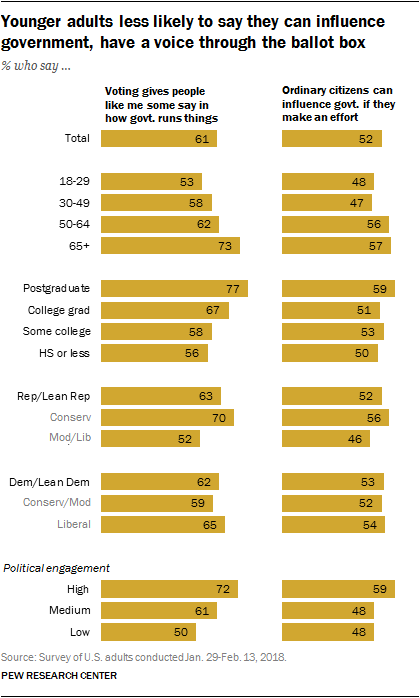 Overall, most adults see voting as an avenue to influence the government: 61% say that “voting gives people like me some say about how government runs things.”
However, on a more general measure of political efficacy, the public is more divided: 52% say ordinary citizens can do a lot to influence government if they make an effort, while 47% say “there’s not much ordinary citizens can do to influence the government in Washington.”
On both measures, younger and less-educated adults are more skeptical about the impact of participation.
The view that voting gives people some say increases with age; while just 53% of adults under 30 say this, that compares with nearly three-quarters of those 65 and older (73%). This age gap is seen in both parties.
Similarly, those under 50 are less likely than their elders (ages 50 and older) to say ordinary citizens can influence government if they make an effort (48% vs. 56%).
Education is also associated with a sense of political efficacy: 77% of postgraduates say voting gives people some say, compared with two-thirds of those with a bachelor’s degree (67%) and 57% of those with less education.
Political engagement is highly correlated with attitudes about voting. Highly engaged adults are considerably more likely to see the value of participation and the potential of “ordinary citizens” to influence governmental policy.
In both parties, those who are more ideological – conservative Republicans and liberal Democrats – are also more likely to view voting as a way for them to have a voice.

 Civics Quiz: What do you know about the U.S. government?