The 2014 political typology divides the public into seven politically engaged groups, along with an eighth group of less engaged Bystanders. The assignment of individuals to one of the seven core typology groups is based on their responses to 23 questions about social and political values.
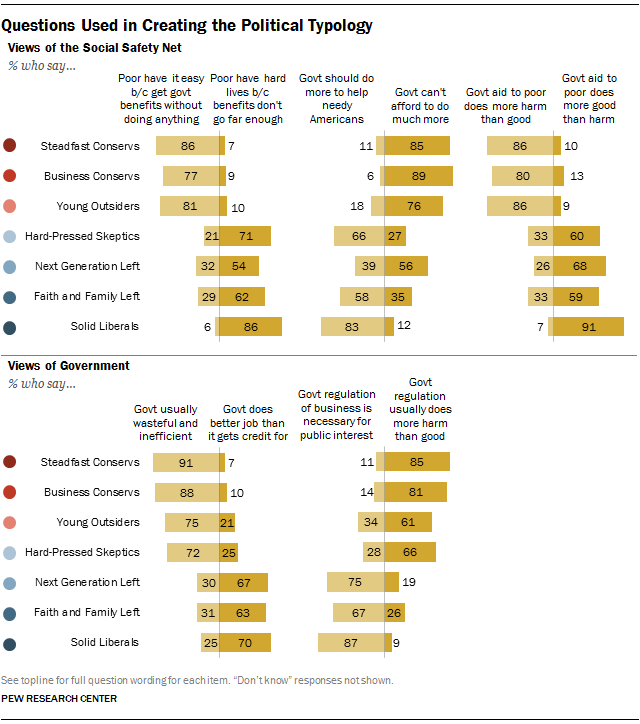
The questions used in the typology construction are in a balanced alternative format where respondents choose which of two statements most closely reflects their own views (Q25 and Q50 in the topline). Items included in the typology construction measure a variety of dimensions of political values and are used to group people in multi dimensional political space. Many of these values are similar to those used in past typology studies; however this year’s typology is a departure from past analyses because it uses individual questions; in prior years, scales measuring underlying political dimensions were constructed using many of the same questions. This new approach allowed for the inclusion of some additional values not used in prior typologies (for instance, values about U.S. involvement in world affairs). In addition, unlike previous typologies, this year’s typology does not include any measure of party affiliation in the model, nor does it include measures of personal financial security.
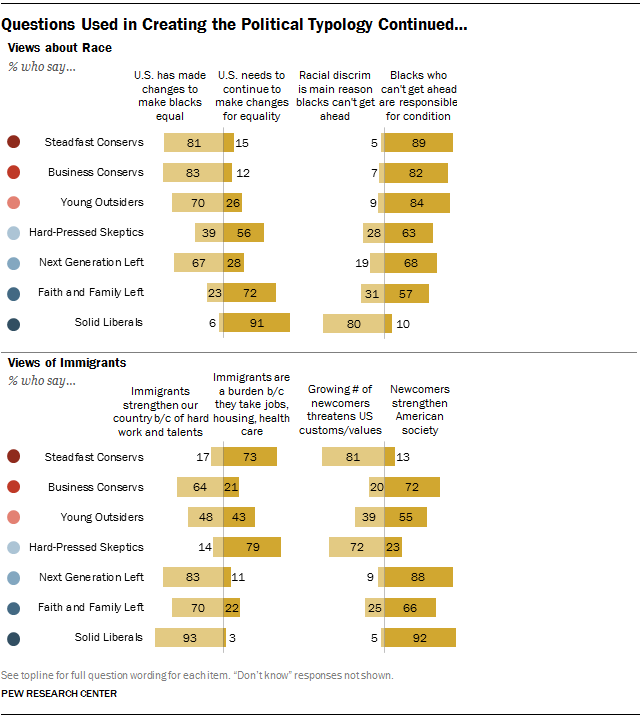
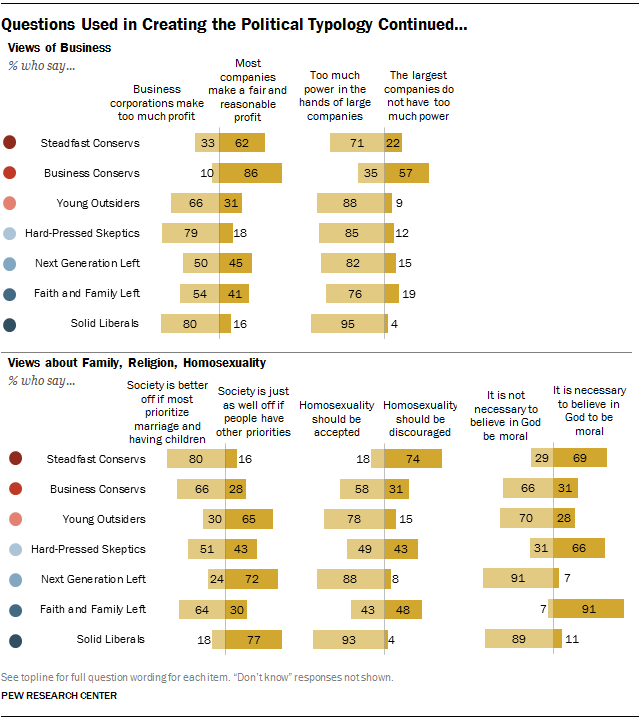
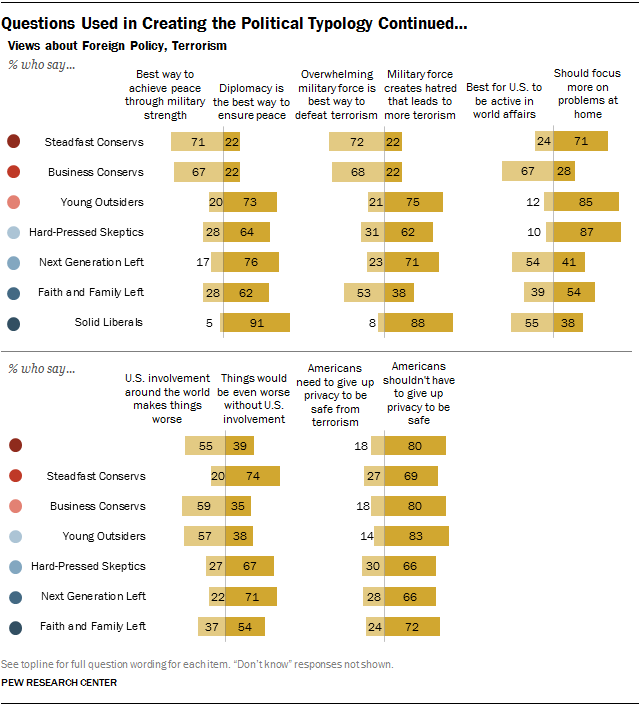
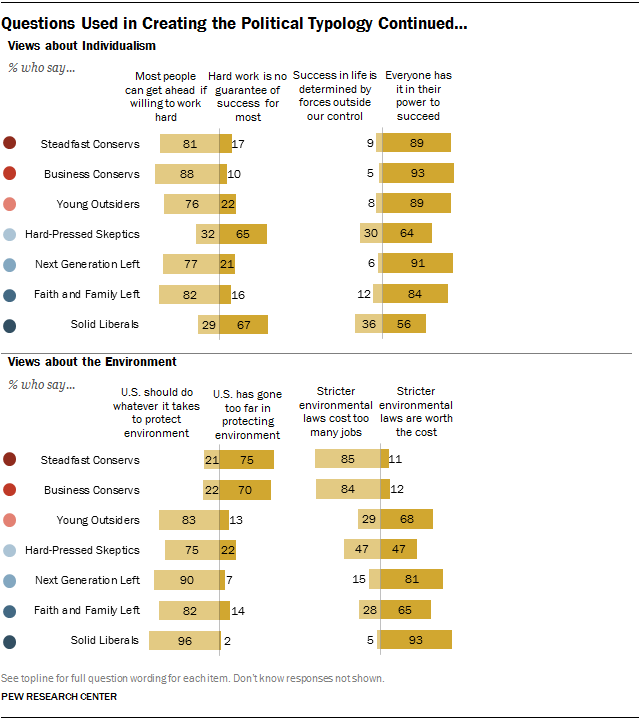
The typology groups are created using cluster analysis, a statistical procedure that uses respondents’ scores on all 23 items to sort them into relatively homogeneous groups. The tables on the following pages show each of the questions and the distribution of responses among of each of the seven typology groups (excluding Bystanders).
Cluster analysis is not an exact process. Different cluster solutions are possible using the same data depending on model specifications and even the order in which respondents are sorted. In order to address the sensitivity of cluster analysis to the order in which cases are entered, each cluster model was run several thousand times, and the results compared, to identify the solution that produced the set of groups that were both homogeneous internally and different from one another with respect to the set of political values. In technical terms, the solution for each model with the lowest sum of squared error of the clusters was chosen. Models with different numbers of clusters were examined, and the results evaluated for their effectiveness in producing cohesive groups that were sufficiently distinct from one another, large enough in size to be analytically practical and substantively meaningful.
While each model differed somewhat from the others, all of them shared certain key features. The final model selected to produce the political typology was judged to be strongest from a statistical point of view, most persuasive from a substantive point of view, and was representative of the general patterns seen across the various cluster solutions.
As in past typologies, a measure of political attentiveness and voting participation was used to extract the “Bystander” group, people who are largely not engaged or involved in politics, before the remaining respondents were sorted into groups. Bystanders are defined as those who are: 1) Not registered to vote; 2) Say they seldom or never vote; and 3) Do not follow government and public affairs most of the time. They represent 10% of the overall population and were held aside prior to scale development and assignment of the remaining 90% of respondents to their typology groups.