The database analysis in this report relied on two separate databases – a consumer database that matched landline numbers to addresses and provided information about the households, such as financial status, lifestyle interests, as well as some basic demographic information about the people in the household. The phone numbers and addresses were then matched to a database containing voter registration status, turnout and, where available, party of registration for voters and non-voters. The companies that provided the databases asked not to be identified by name.
Each phone number was matched to a maximum of two household records in the consumer database; when a phone number was matched to more than one household, the more complete record was selected for the analysis presented in the report. There was at least some information available about the household for 18,164 landline phone numbers; 1,931 were households where an adult completed the interview, 8,913 were households that did not participate in the survey and 7,320 were for numbers that were determined to be non-working or non-residential (and thus are excluded from the analysis). For the analysis comparing respondents to non-respondents, phone numbers for which no contact was made and thus could not be determined with any certainty to be a residential household are weighted down to represent the proportion assumed to be eligible.6 An additional 854 phone numbers in the cell frame were also matched to household records in the consumer database based on names and addresses provided during the survey interview; matching other cell phone numbers was not possible. Thus, the analysis presented in the report is limited to numbers in the landline frame and it is unknown whether similar patterns would be observed between respondents and non-respondents in the cell phone frame.
The phone numbers and address information obtained from the consumer database were then matched to individuals in the voter database. Each phone number was matched to a maximum of six individual records in the voter database. For numbers that were matched to only one record in the voter database, voter information for that match was used in the analysis (90% of survey respondents were matched to only one record). The remainder of the numbers had more than one match. For households that did not respond to the survey, no additional steps were taken to try to select which of the records was the best match.7
For households that did respond, survey data was used to select which of the records best matched the data obtained from survey respondents on sex, age (the age of the survey respondent and person in the record had to differ by four years or less) and race (white/non-white). Finally, in cases where more than one possible match still existed, a match was accepted if the respondent’s state of residence matched the state of residence in one of the voter records. A best match was chosen for 12,648 landline phone numbers, including 1,490 survey respondents. The voter database does not have party information on many respondents, since not all states collect that information in voter registration records. In addition, it is unclear how complete voting records are in the voting database, since the quality of voter registration records varies by state.
Comparing Survey Responses to Information in the Databases

The utility of the two national databases for judging the representativeness of the survey sample depends not only on the share of the survey sample for which database information is available for, but it also depends on the accuracy of the information in the databases. To assess the accuracy of the information in the databases, household information in the databases for survey respondents was compared with answers given during the survey.
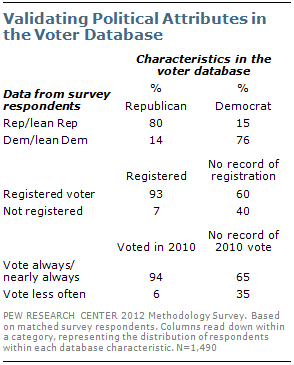
Information from the voter database about voter registration, party registration and turnout in 2010 was fairly consistent with what respondents reported in the survey. Among those flagged as registered Republicans by the database, 80% said they are Republicans or lean to the Republican Party. Similarly, 76% of registered Democrats said they are Democrats or lean Democratic.
Those listed as registered in the voter database were overwhelmingly likely to report themselves as registered in the survey (93%). However, 60% of those for whom there was no record of active registration in the database said they are registered to vote.
Respondents to the survey were not asked if they voted in the 2010 congressional elections, but were asked how frequently they voted.

Among those flagged in the database as having voted in 2010, 94% said in the survey that they always or nearly always voted. Those for whom the database shows no record of a 2010 vote were less likely to say they always or nearly always vote (65%), including only 41% who say they always vote.
The consumer database contained demographic and lifestyle information about households in the sample, including information on income, financial status, home value and a range of personal interests and traits not available in the voting database.
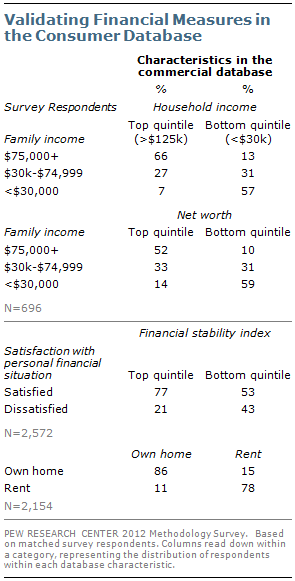
The financial characteristics of households according to the database comport reasonably well with financial information provided by respondents. About tw0-thirds (66%) of respondents in households the database categorizes as being in the top 20% of family incomes say their household earns over $75,000 a year. Comparably, 57% of respondents in households in the bottom 20% of family incomes report that they make $30,000 a year or less. About half of those in households categorized at both the top and bottom quintiles of net worth report being in a corresponding income category (52% of those in the top quintile report making $75,000 or more and 59% of those in the bottom quintile make $30,000 or less).
The database also has a financial stability index. Respondents in 77% of households rated as within the top 20% of the index (the most stable households) say they are satisfied with

their personal financial situation. Among those rated in the bottom 20% of the index, 53% of respondents report being satisfied with their financial situation while 43% are dissatisfied.
Measures of home ownership were also largely consistent with respondents’ answers; 86% of those listed as owners said they owned their homes and 78% of those listed as renters in the database confirmed that they rented.
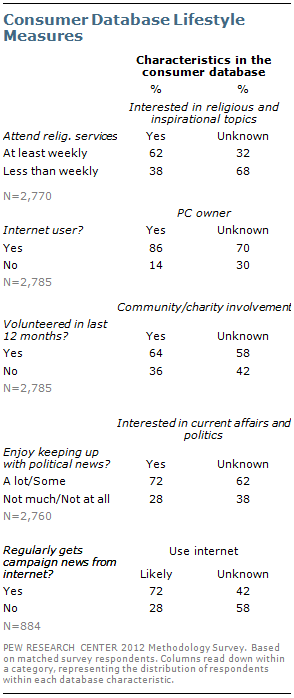
In addition, the database flags households considered to be interested in a variety of topics and activities. Many of these were not asked about in the survey, but for a few, comparisons can be made with questions in the survey that are similar. Of those the commercial database labels as interested in religious and inspirational topics, 62% report attending religious services weekly or more, compared with only 32% among those not labeled as interested.
Among people flagged as owning home computers, 86% identify as internet users in the survey; among those not flagged as computer owners in the database, 70% are internet users.
For those the consumer database identifies as interested in community or charity involvement, 64% said they had volunteered in the previous year. However, among those the database does not flag as interested, 58% said they volunteered in the last year, only slightly lower than among the flagged households.
An interest in current affairs or politics is also identified in the database. A 72% majority of those listed as interested in current affairs say they enjoy keeping up with political news a lot or some. This compares with 62% among those not flagged as interested in current affairs.
The standard survey also asked respondents about where they get news about the presidential election. Fully 72% of those identified in the database as in the top 30% of likely heavy internet users said the internet was a source for election news, compared with only 42% of those not identified as a heavy internet user. Those flagged as likely to be heavy newspaper readers and heavy watchers of primetime TV were more likely than those not flagged to say they get campaign news from the sources (38% vs. 25% for newspapers and 88% vs. 72% for primetime TV). However, there is no difference between those flagged and not flagged as heavy radio listeners or magazine readers.
Comparisons of Responding and Refusing Households

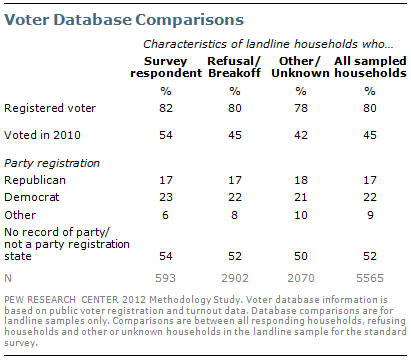
These tables show comparisons from the two databases, with non-respondents separated into two groups: refusals and breakoffs, which are confirmed households, and other working numbers for which no contact was made. The latter group likely includes eligible residential households as well as non-residential phone numbers.


