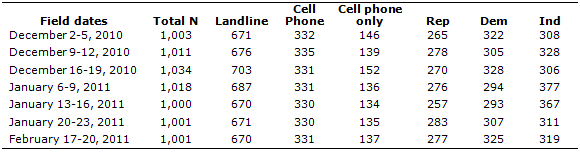
Results for the seven surveys used in this report are based on telephone interviews conducted by interviewers at Princeton Data Source under the direction of Princeton Survey Research Associates International among national samples of approximately 1,000 adults 18 years of age or older living in the continental United States. A combination of landline and cell phone random digit dial samples were used and both samples were provided by Survey Sampling International. Interviews were conducted in English. Respondents in the landline sample were selected by randomly asking for the youngest adult male or female who is now at home. Interviews in the cell sample were conducted with the person who answered the phone, if that person was an adult 18 years of age or older. For detailed information about our survey methodology, see: https://www.pewresearch.org/politics/methodology/detailed. The table below shows the field dates and sample sizes for general public and for Republicans, Democrats and independents for each survey:
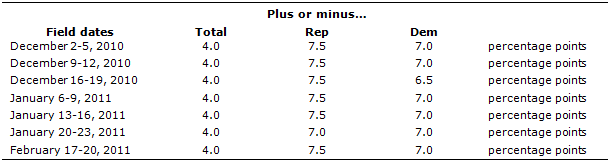
The combined landline and cell phone samples are weighted using an iterative technique that matches gender, age, education, race, Hispanic origin, region, and population density. For the 2011 surveys, data were weighted to parameters from the March 2010 Census Bureau’s Current Population Survey. For the 2010 surveys, data were weighted to parameters from the March 2009 Census Bureau’s Current Population Survey. The samples also are weighted to match current patterns of telephone status and relative usage of landline and cell phones (for those with both), based on extrapolations from the 2010 National Health Interview Survey for the 2011 data and from the 2009 National Health Interview Survey for the 2010 data. The weighting procedure also accounts for the fact that respondents with both landline and cell phones have a greater probability of being included in the combined sample and adjusts for household size within the landline sample. Sampling errors and statistical tests of significance take into account the effect of weighting. The following table shows the margins of error attributable to sampling that would be expected at the 95% level of confidence for different groups in the survey:
Sample sizes and sampling errors for other subgroups are available upon request.
In addition to sampling error, one should bear in mind that question wording and practical difficulties in conducting surveys can introduce error or bias into the findings of opinion polls.
