Independents often are portrayed as political free agents with the potential to alleviate the nation’s rigid partisan divisions. Yet the reality is that most independents are not all that “independent” politically. And the small share of Americans who are truly independent – less than 10% of the public has no partisan leaning – stand out for their low level of interest in politics.
Among the public overall, 38% describe themselves as independents, while 31% are Democrats and 26% call themselves Republicans, according to Pew Research Center surveys conducted in 2018. These shares have changed only modestly in recent years, but the proportion of independents is higher than it was from 2000-2008, when no more than about a third of the public identified as independents. (For more on partisan identification over time, see the 2018 report “Wide Gender Gap, Growing Educational Divide in Voters’ Party Identification.”)
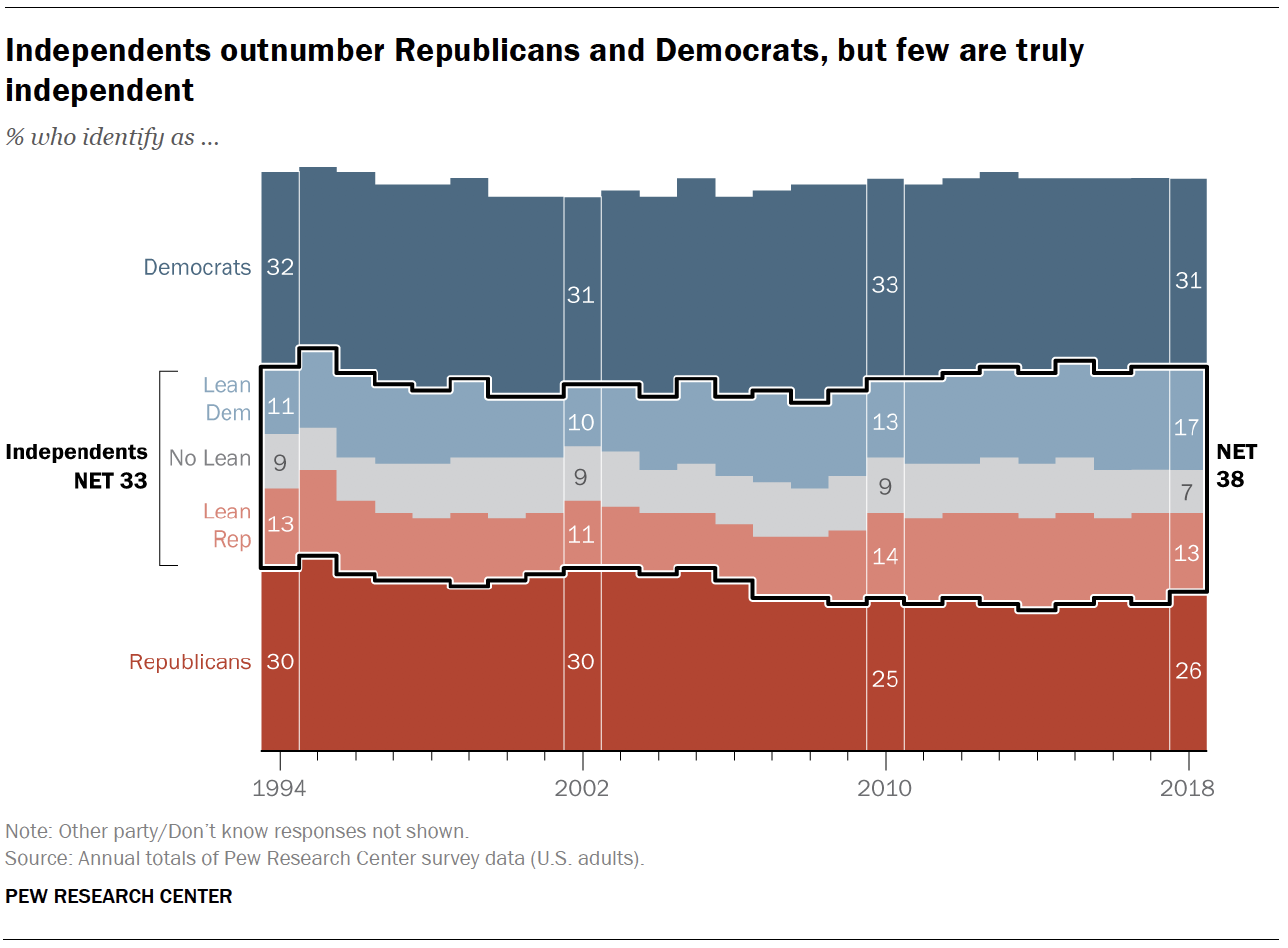
An overwhelming majority of independents (81%) continue to “lean” toward either the Republican Party or the Democratic Party. Among the public overall, 17% are Democratic-leaning independents, while 13% lean toward the Republican Party. Just 7% of Americans decline to lean toward a party, a share that has changed little in recent years. This is a long-standing dynamic that has been the subject of past analyses, both by Pew Research Center and others.
In their political attitudes and views of most issues, independents who lean toward a party are in general agreement with those who affiliate with the same party. For example, Republican-leaning independents are less supportive of Donald Trump than are Republican identifiers. Still, about 70% of GOP leaners approved of his job performance during his first two years in office. Democratic leaners, like Democrats, overwhelmingly disapprove of the president.
There are some issues on which partisan leaners – especially those who lean toward the GOP – differ substantially from partisans. While a narrow majority of Republicans (54%) opposed same-sex-marriage in 2017, nearly six-in-ten Republican-leaning independents (58%) favored allowing gays and lesbians to marry legally.
Yet independents who lean toward one of the two parties have a strong partisan imprint. Majorities of Republican and Democratic leaners have a favorable opinion of their own party, and they are almost as likely as Republican and Democratic identifiers to have an unfavorable opinion of the opposing party.
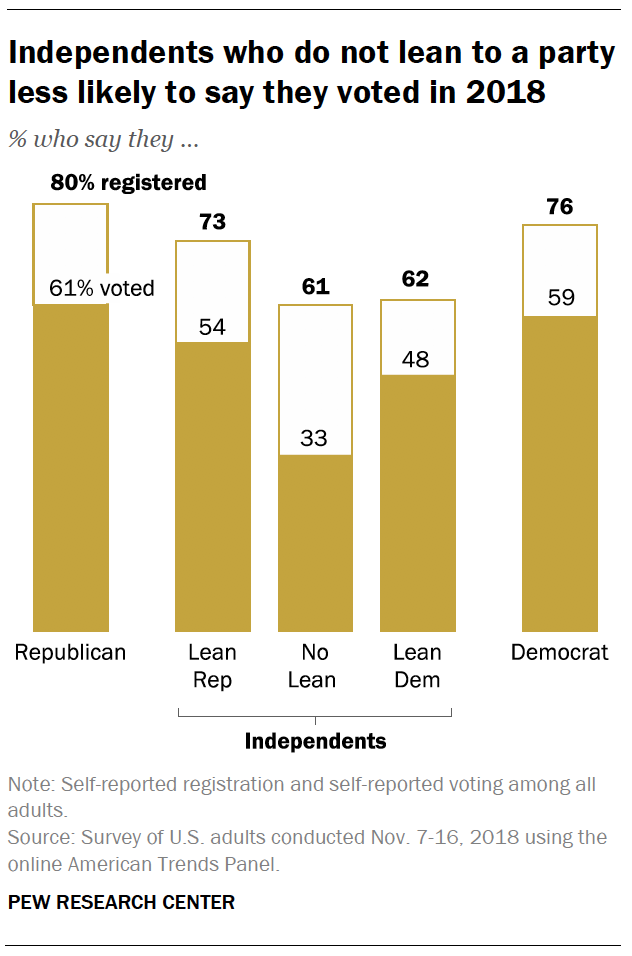
Independents stand out from partisans in several important ways. They are less politically engaged than Republicans or Democrats – and this is especially the case among independents who do not lean to a party.
In a survey conducted last fall, shortly after the midterm elections, partisan leaners were less likely than partisans to say they registered to vote and voted in the congressional elections. About half of Democratic-leaning independents (48%) said they voted, compared with 59% of Democrats. The differences were comparable between GOP leaners (54% said they voted) and Republicans (61%).
Those who do not lean toward a party – a group that consistently expresses less interest in politics than partisan leaners – were less likely to say they had registered to vote and much less likely to say they voted. In fact, just a third said they voted in the midterms.
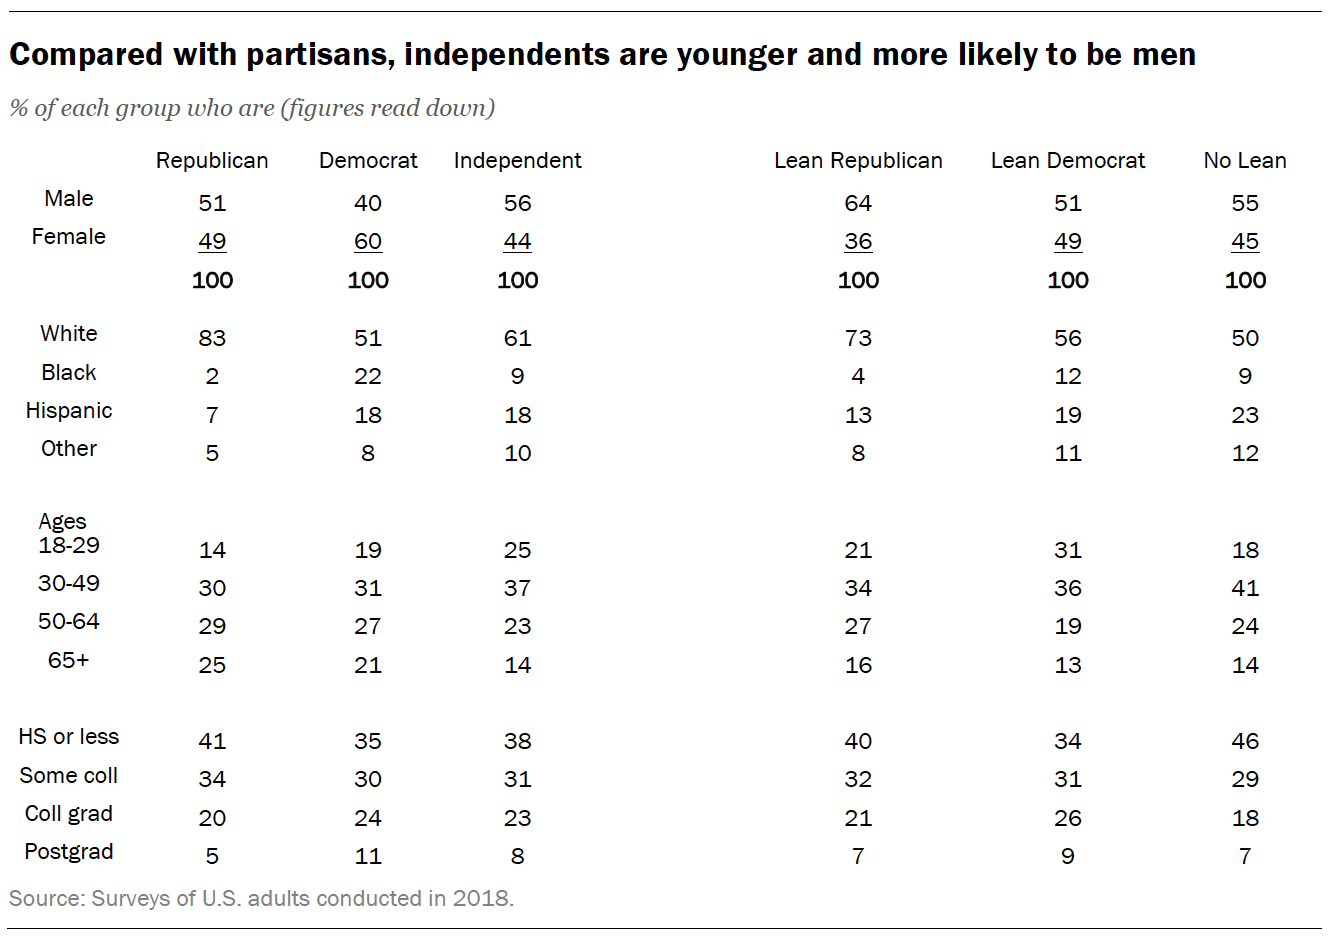
In addition, independents differ demographically from partisans. Men constitute a majority (56%) of independents. That is higher than the share of men among Republican identifiers (51% are men) and much higher than the share of men among Democrats (just 40%).
Among independents, men make up a sizable share (64%) of Republican leaners and a smaller majority (55%) of independents who do not lean. Democratic leaners include roughly equal shares of men (51%) and women (49%).
Independents also are younger on average than are partisans. Fewer than half of independents (37%) are ages 50 and older; among those who identify as Democrats, 48% are 50 and older, as are a majority (54%) of those who identify as Republicans.
Democratic-leaning independents are younger than other independents or partisans. Nearly a third (31%) are younger than 30, compared with 21% of Republican-leaning independents and just 19% and 14%, respectively, among those who identify as Democrats and Republicans.
Trump divides partisans and partisan leaners alike
As Pew Research Center reported last year, Donald Trump’s job approval rating during the early stage of his presidency is more polarized along partisan lines than any president in the past six decades. In addition, Trump’s rating has been more stable than prior presidents.
During his first two years in office, Trump’s job rating among members of his own party was relatively high compared with recent presidents. In 2017, 85% of those who identify as Republicans approved of Trump’s job performance, based on an average of Pew Research Center surveys. His job rating among Republicans was about as high (84%) in 2018. Trump’s early job rating among members of the opposing party (7%) was much lower than those of three prior presidents (Barack Obama, George W. Bush and Bill Clinton).
Trump’s job rating among independents for his first two years in office also was lower than his recent predecessors; his average job rating among independents was 34% in both 2017 and 2018. Obama’s average rating was 50% during his first year (2009); it fell to 42% in his second year.
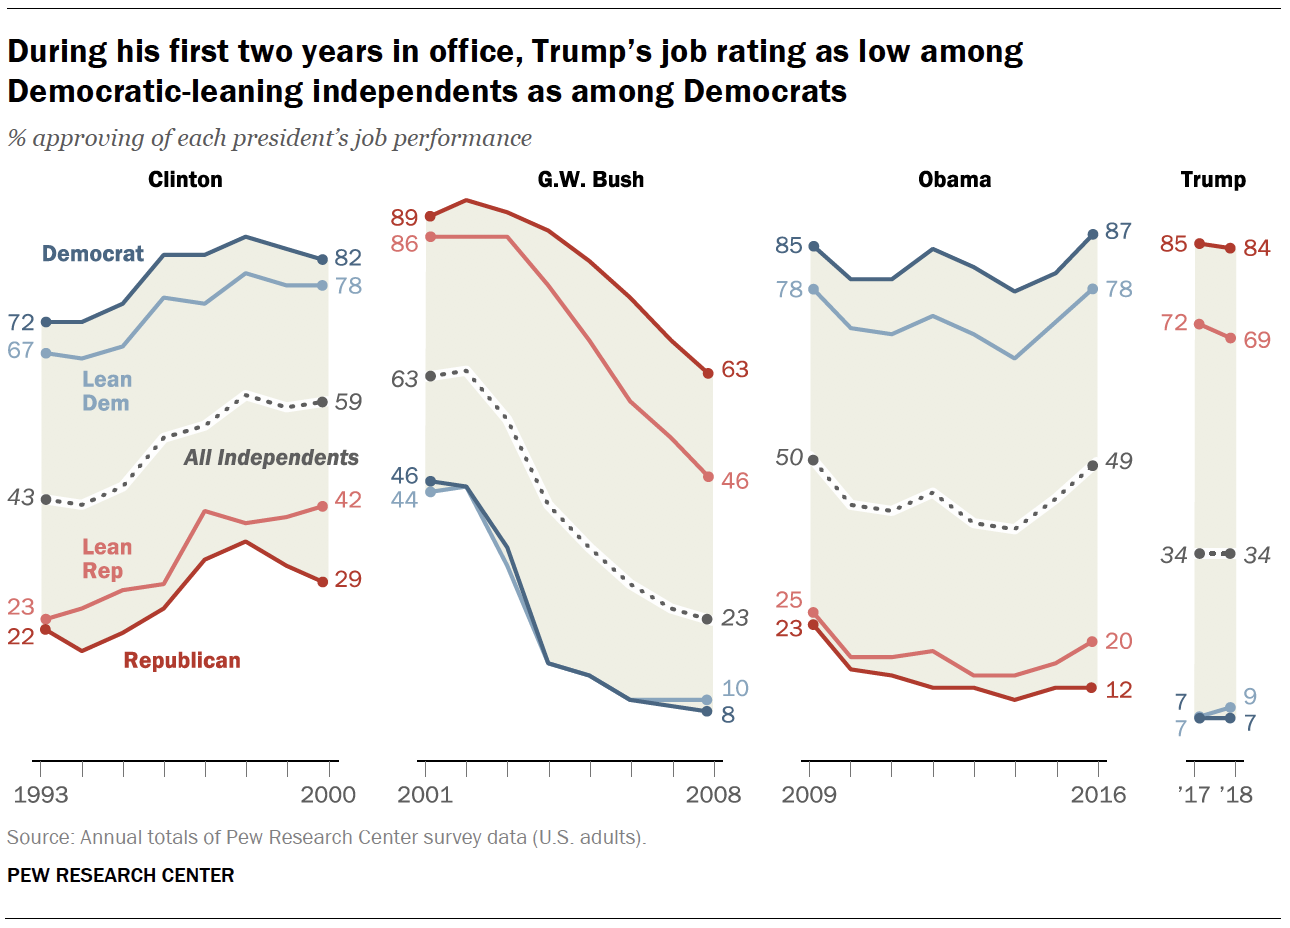
Trump’s early rating among independents is closest to Clinton’s, whose job approval averaged about 42% during his first two years in office. Bush, whose overall job rating approached 90% in his first year following the 9/11 terrorist attacks, had approval ratings above 60% among independents in his first two years.
Trump’s job rating among independents, like his overall rating, breaks down along partisan lines. His rating among GOP-leaning independents (72% in 2017, 69% in 2018) was not markedly different from Obama’s and Clinton’s ratings among Democratic-leaning independents during their first two years in office (though much lower than Bush’s among Republican leaners).
Yet Trump’s rating among independents who lean to the opposing party – like his rating among members of the opposing party – was much lower than recent presidents’. In fact, his rating among Democratic-leaning independents during his first two years was about as low as his rating among Democrats (7% in 2017, 9% in 2018).
Trump’s rating also was low among independents who have no partisan leanings. Only about a quarter of non-leaners approved of Trump’s job performance during his first two years, while about six-in-ten (58%) disapproved.
Independents’ views of U.S.-Mexico border wall, other key issues
On most issues, independents’ attitudes mirror the views of the overall public. Independents who lean toward a party are usually on the same side as those who identify with the same party, but the level of agreement between leaners and partisans varies depending on the issue.
By a wide margin (62% to 36%), independents oppose Trump’s signature policy proposal, an expansion of the U.S.-Mexico border wall. Democratic-leaning independents overwhelmingly oppose the border wall (95% disapprove), as do Democratic identifiers (92%).
Republican-leaning independents favor expanding the border wall, though by a smaller margin than Republicans identifiers. GOP leaners favor substantially expanding the wall along the U.S.-Mexico border by roughly three-to-one (75% to 23%). Among those who affiliate with the Republican Party, the margin is nearly eight-to-one (87% to 11%).
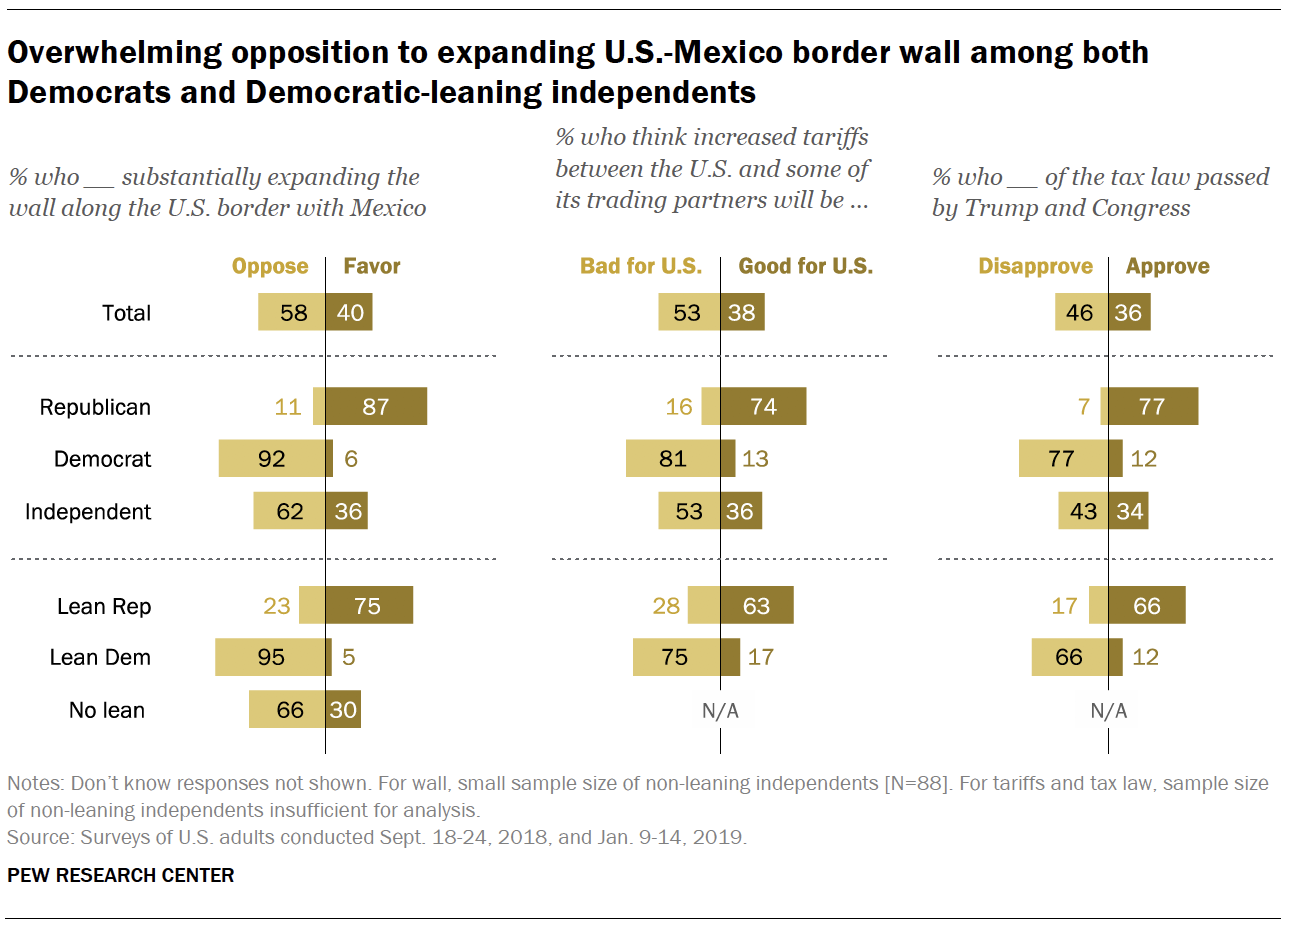
Independents also have a negative view of increased tariffs between the U.S. and its trading partners (53% say they will be bad for the U.S., 36% good for the U.S.). Independents’ views on the 2017 tax bill are more divided: 34% approve of the tax law and 43% disapprove.
As with the border wall, Democratic-leaning independents are more likely to view increased tariffs negatively (75% say they will be bad for the U.S.) than Republican-leaning independents are to view them positively (66% say they will be good). On taxes, two-thirds of GOP leaners approve of the tax law, while an identical share of Democratic leaners disapprove.
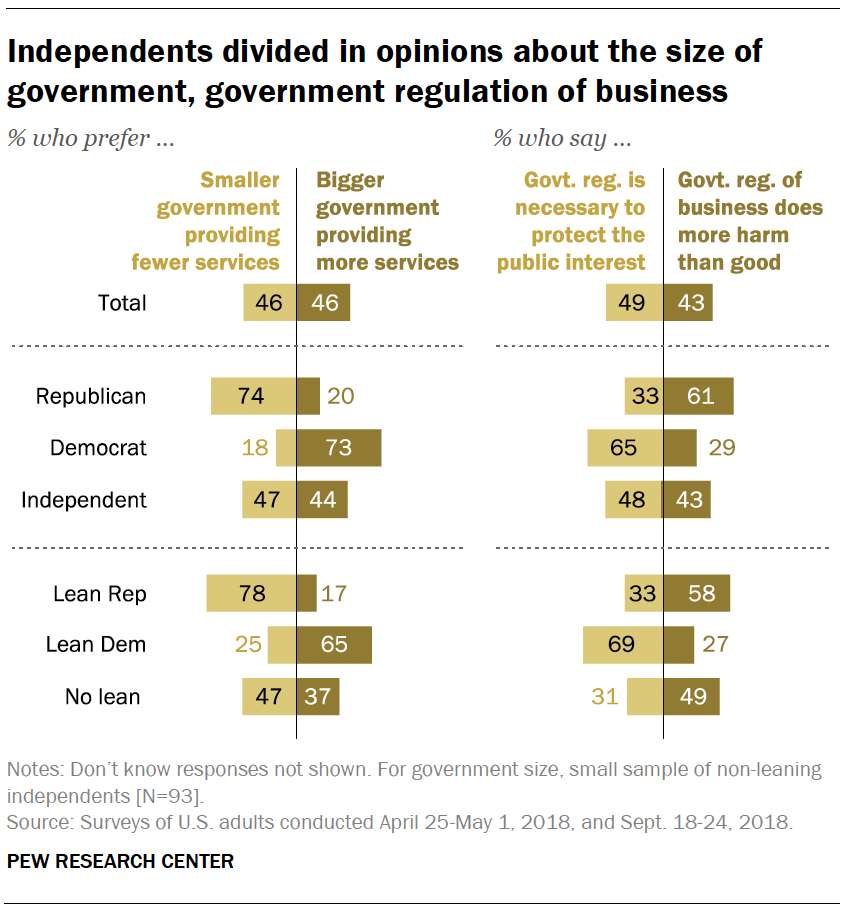
Overall, independents are divided in preferences about the size of government and views about government regulation of business.
Republican-leaning independents largely prefer a smaller government providing fewer services; 78% favor smaller government, compared with just 17% who favor bigger government with more services.
The views of GOP leaners are nearly identical to the opinions of those who affiliate with the GOP (74% prefer smaller government). Like Democrats, most Democratic-leaning independents prefer bigger government.
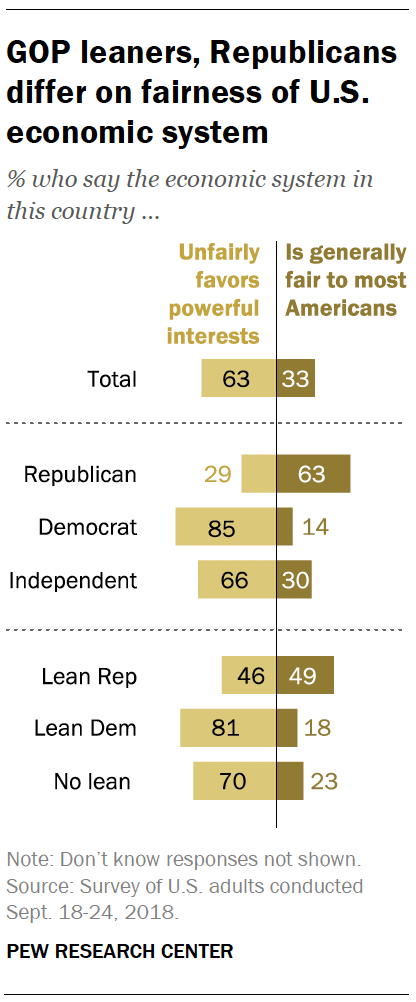
Democrats and Democratic leaners are in sync in opinions about whether the nation’s economic system is generally fair. But there are sharper differences in the views of Republicans and GOP leaners.
A 63% majority of those who identify as Republicans say the U.S. economic system is fair to most Americans; fewer than half as many (29%) say the system unfairly favors powerful interests. GOP leaners are divided: 49% say the system is generally fair, while nearly as many (46%) say it unfairly favors powerful interests.
Large majorities of both Democrats (85%) and Democratic leaners (81%) say the U.S. economic system unfairly favors powerful interests. Most independents who do not lean toward a party share this view (70%).
Independents’ views of race, immigrants, gender
Majorities of independents say the U.S. needs to continue to make changes to give blacks equal rights with whites (57%) and that significant obstacles still make it harder for women to get ahead (54%). In addition, far more independents say immigrants do more to strengthen (66%) than burden (23%) the country.
In views of racial equality and women’s progress, the views of partisan leaners are comparable to those of partisans. Large majorities of Democrats and Democratic leaners say the U.S. needs to make more changes to give blacks equal rights and that significant obstacles stand in the way of women. Most Republicans and Republican leaners say the country has made needed changes to give blacks equal rights with whites, and that the obstacles blocking women’s progress are largely gone.
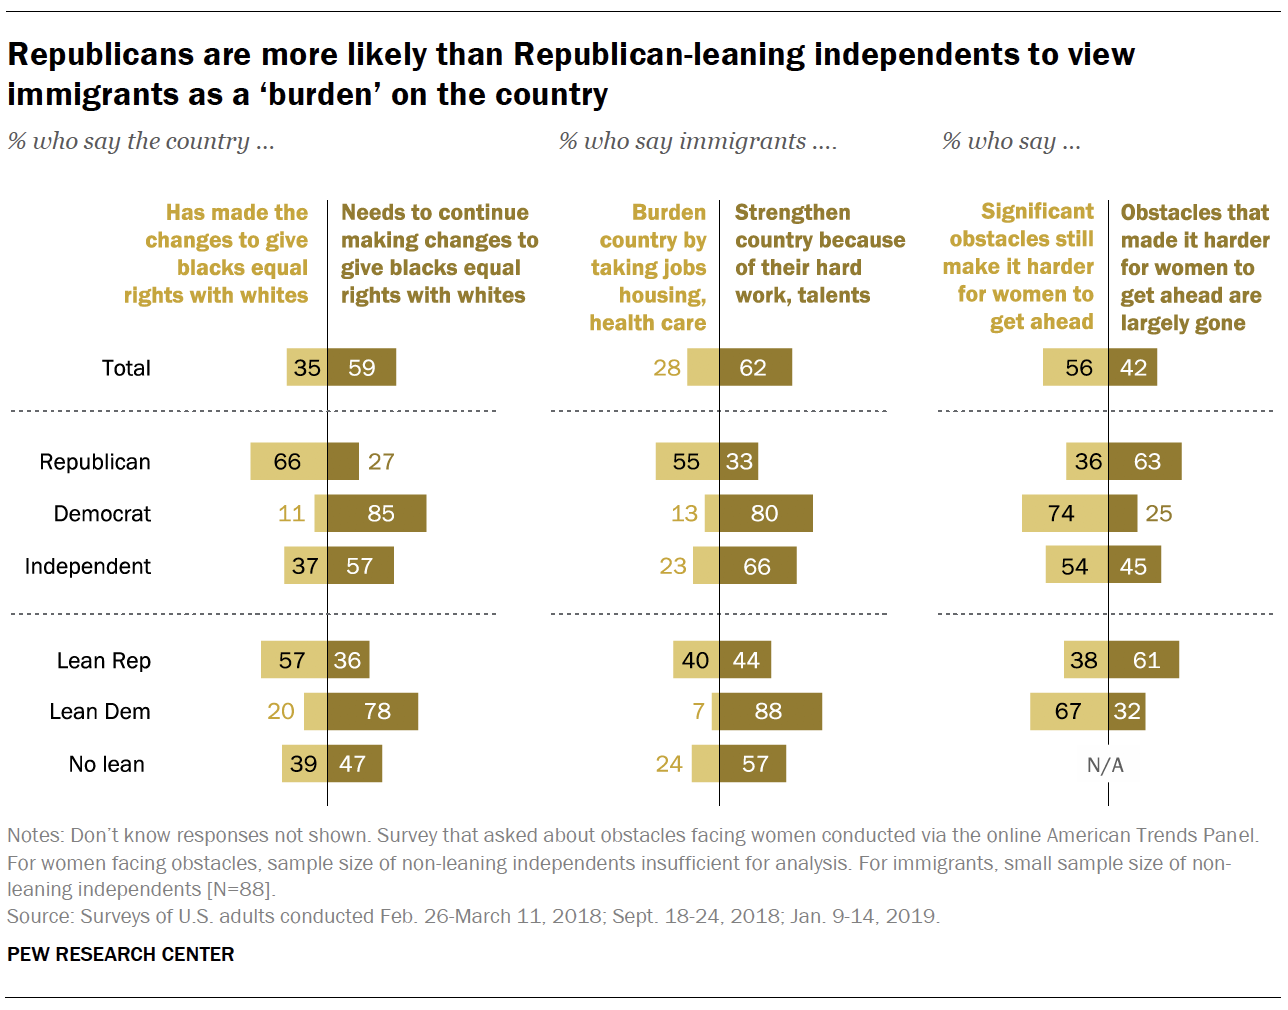
However, Republican-leaning independents differ from Republicans in their views of immigrants’ impact on the country. Among GOP leaners, 44% say immigrants strengthen the country because of their hard work and talents; 40% say they are a burden on the country because they take jobs, housing and health care. A majority of those who identify as Republicans (55%) say immigrants burden the country.
Views of immigrants’ impact on the country are largely positive among Democratic-leaning independents (88% say they strengthen the U.S.) and those who identify as Democrats (80%).
Broad support among independents for same-sex marriage, marijuana legalization
Public support for same-sex marriage has grown rapidly over the past decade. In June 2017, a majority of adults (62%) favored allowing gays and lesbians to marry legally, while just 32% were opposed.
Independents’ views of same-sex-marriage were similar to Democrats’: 73% of Democrats favored gay marriage, as did 70% of independents. Among those who identified as Republicans, just 40% favored same-sex marriage, while 54% were opposed.
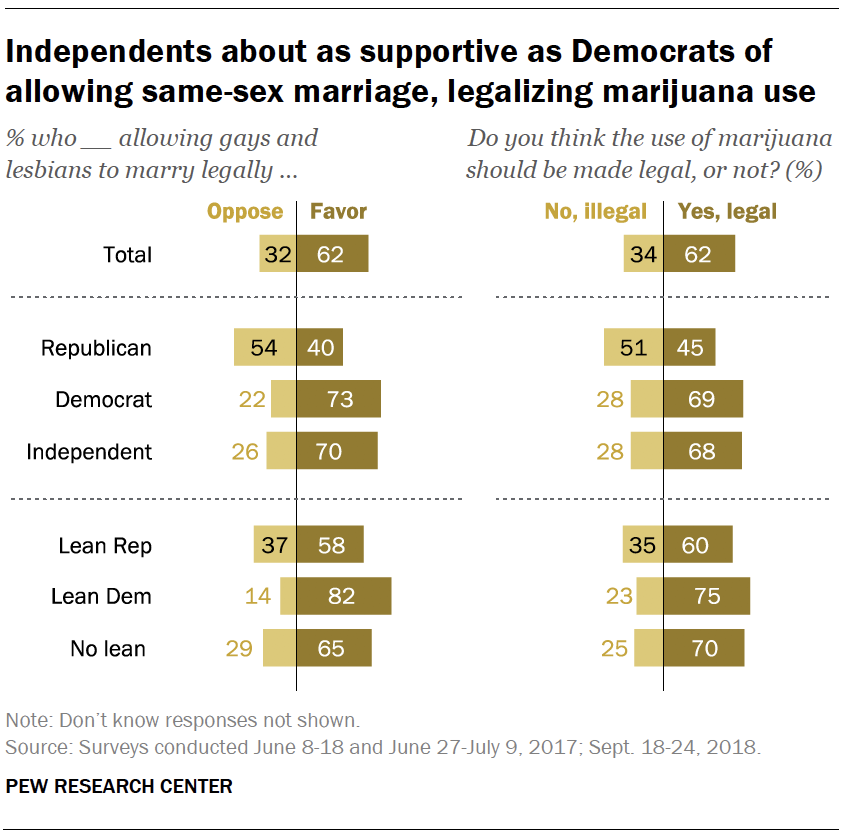
In contrast to Republicans, Republican-leaning independents favored same-sex marriage (58% were in favor, 37% were opposed). Support for same-sex marriage was higher among Democratic-leaning independents than among Democrats (82% vs. 73%).
Public support for legalizing marijuana use has followed a similar upward trajectory in recent years. Currently, 62% of the public says the use of marijuana should be made legal, while 34% say it should be illegal.
Majorities of both Democrats (69%) and independents (68%) favor legalizing marijuana; Republicans are divided, with 45% supportive of legalization and 51% opposed. Among GOP-leaning independents, a 60% majority favors legalizing marijuana. And a large majority of Democratic-leaning independents (75%) also favors marijuana legalization.
Independents who do not lean to a party widely favored same-sex marriage (65% favor this), while 70% say the use of marijuana should be legal.
More partisans and partisan leaners embrace ideological labels
As in the past, more independents describe their political views as moderate (43%) than conservative (29%) or liberal (24%). These shares have changed little in recent years.
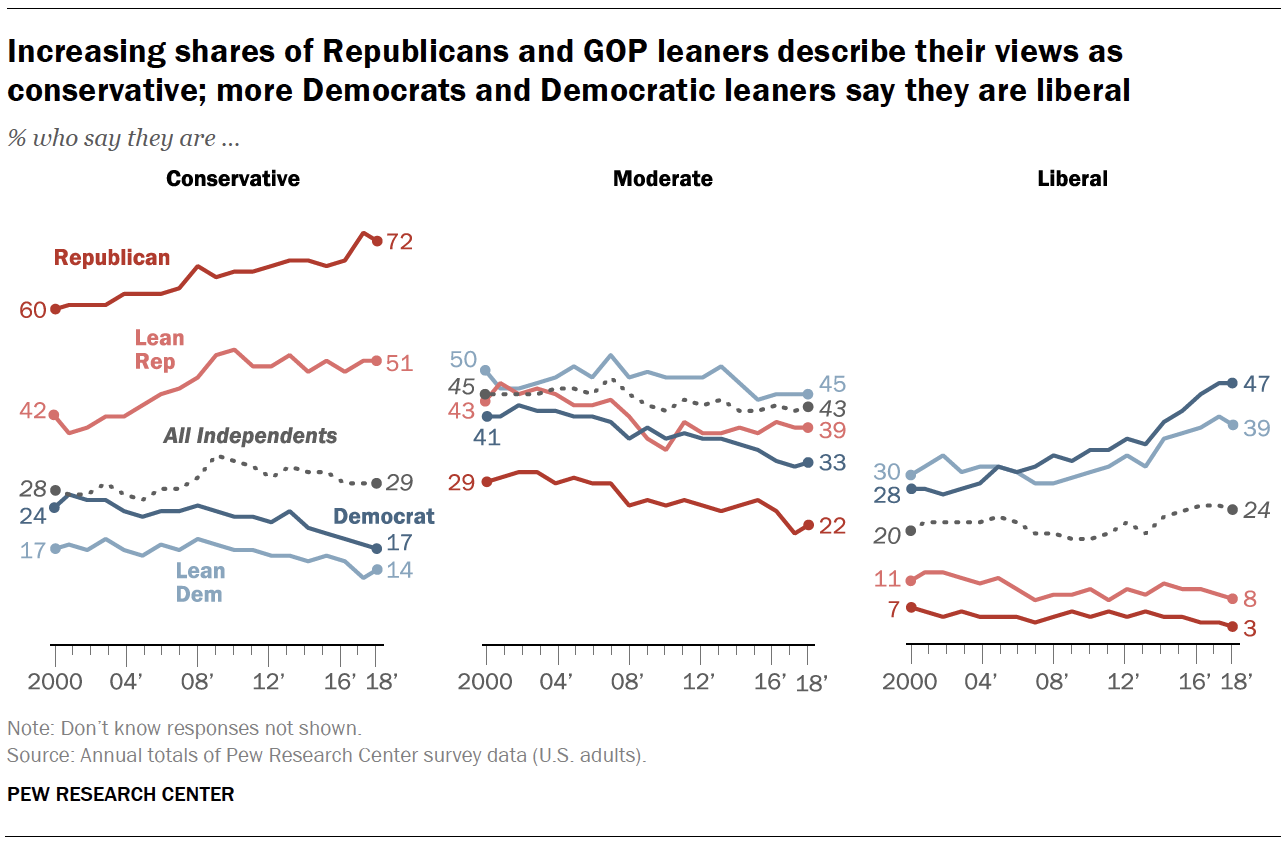
Since 2000, there have been sizable increases in the shares of both Republicans and Republican-leaning independents who identify as conservative. Today, more Republican-leaning independents describe themselves as conservatives (51%) than as moderates (39%) or liberals (8%). In 2000, GOP leaners included almost identical shares of conservatives (42%) and moderates (43%); 11% described their views as liberal.
Over the same period, there has been growth in the shares of Democrats and Democratic leaners identifying as liberal. Among Democratic-leaning independents, slightly more identify as moderates (45%) than as liberals (39%), while 14% are conservatives. But the gap has narrowed since 2000, when moderates outnumbered liberals, 50% to 30%.
By contrast, moderates continue to make up the largest share of independents who do not lean to a party. Nearly half of independents who do not lean to a party describe their views as moderate, while 24% are conservatives and 18% are liberals. These numbers have changed little since 2000.
How independents view the political parties
In a two-party system, it is not surprising that most Americans view their own party favorably while viewing the opposing party unfavorably. Two-thirds of Americans (66%) view one party favorably while expressing an unfavorable opinion of the other party. About one-in-five (17%) feel unfavorably toward both parties, while 12% feel favorably toward both.
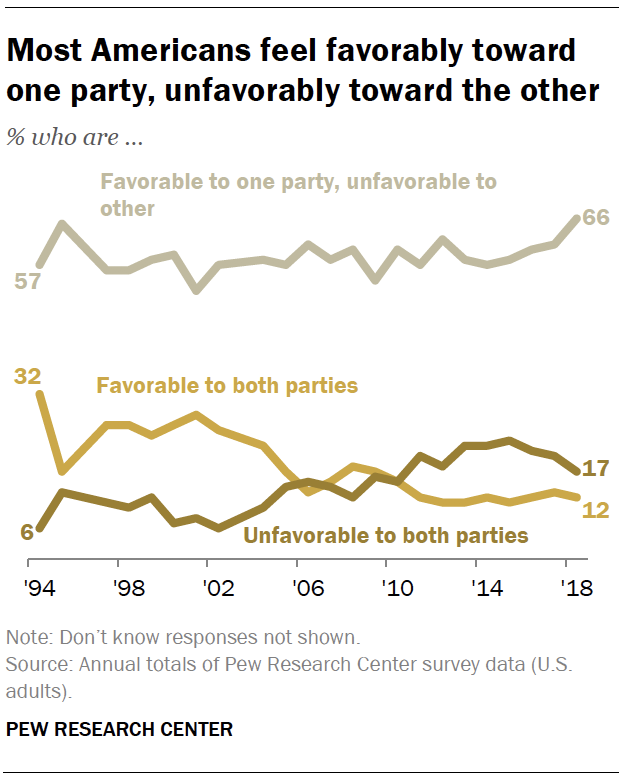
The share of Americans who have a positive view of one party and a negative view of the other has increased since 2015 (from 58%). Over the same period, there has been a decline in the share expressing a negative view of both parties, from 23% in 2015 to 17% currently.
Independents who lean toward a party are less likely than partisans to view their party favorably. In addition, far more independents (28%) than Republicans (10%) or Democrats (9%) have an unfavorable opinion of both parties.
Still, the share of independents who view both parties negatively has declined in recent years. At one point in 2015, more than a third of independents (36%) viewed both parties unfavorably.
Most of the change since then has come among Republican-leaning independents, who feel much more positively about the GOP than they did then. In July 2015, just 44% of GOP leaners had a favorable opinion of the Republican Party; 47% had an unfavorable view of both parties. Today, a majority of GOP leaners view the Republican Party favorably (55%), while just 24% view both parties unfavorably.
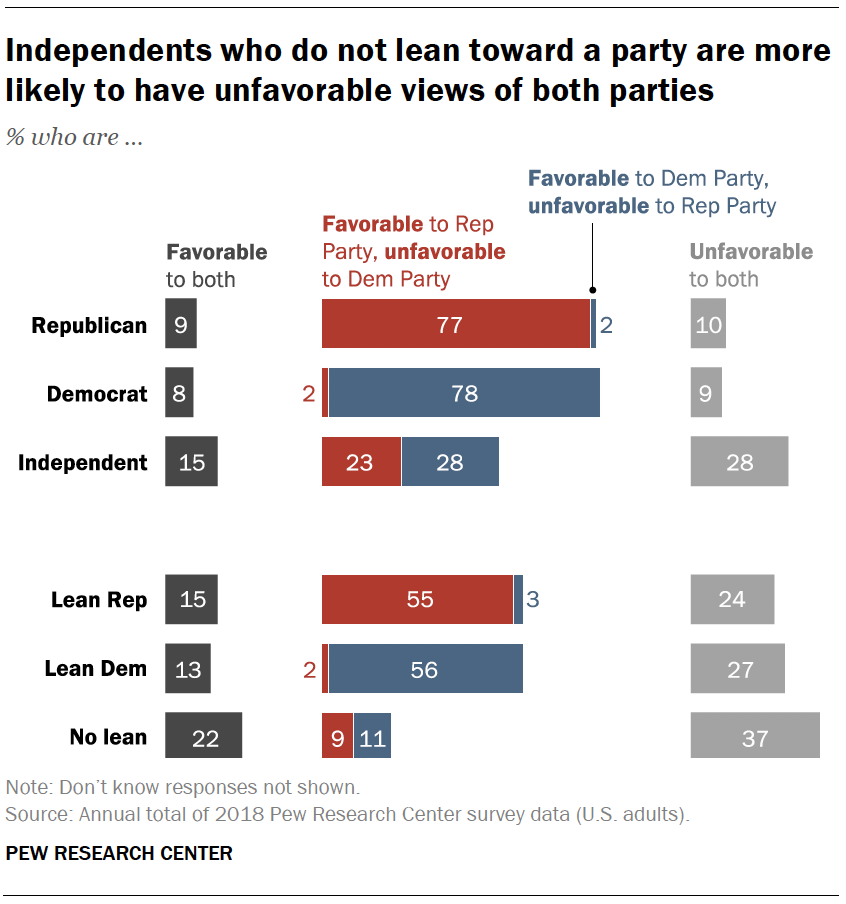
Independents who do not lean to a party are most likely to have an unfavorable opinion of both parties (37%). Another 22% have favorable opinions of both parties. Just 11% of independents who do not lean to a party view the Democratic Party favorably, while about as many (9%) have a favorable view of the GOP.
Growing partisan antipathy among partisans and leaners
Over the past two decades, Republicans and Democrats have come to view the opposing party more negatively. The same trend is evident among independents who lean toward a party.
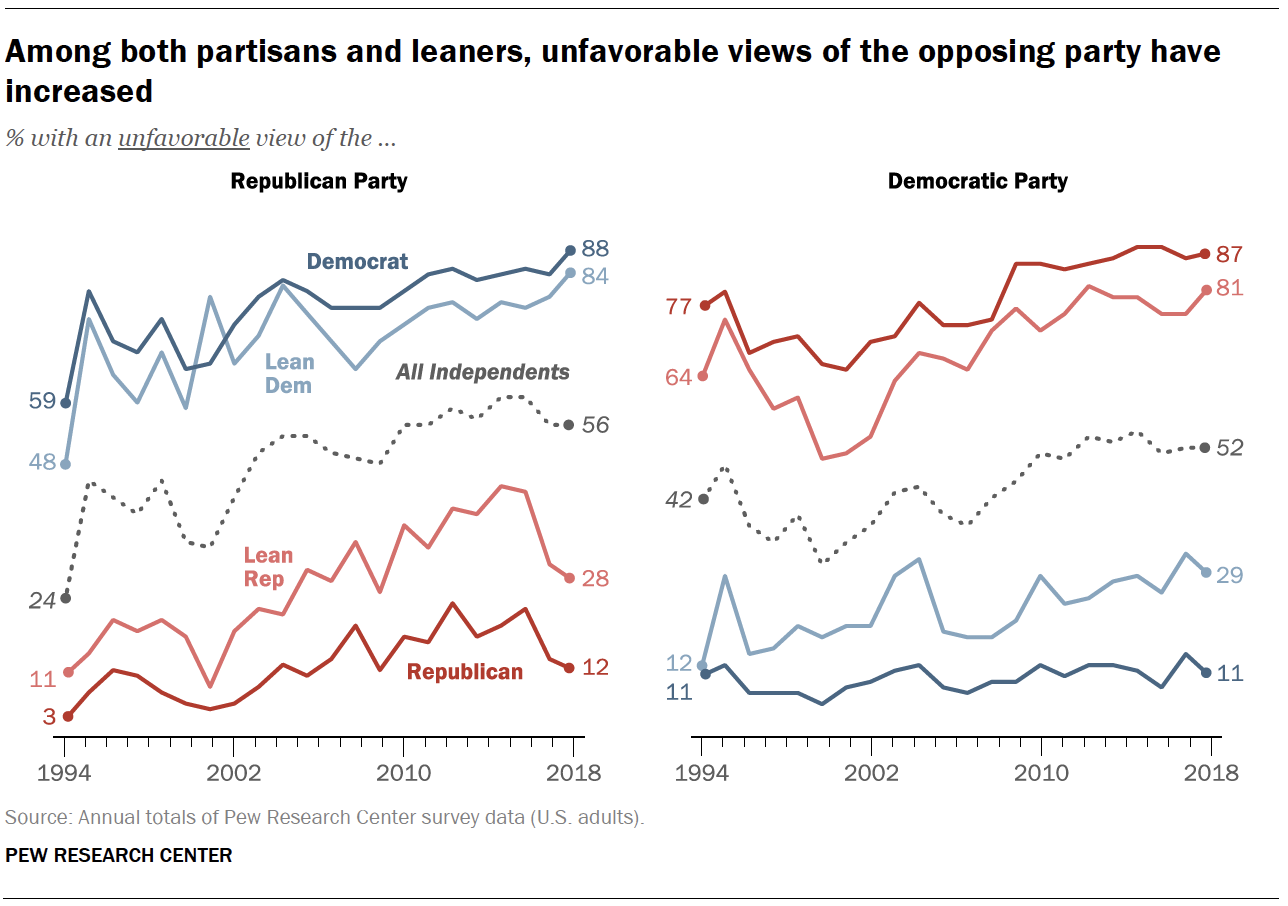
Currently, 87% of those who identify with the Republican Party view the Democratic Party unfavorably; Republican-leaning independents are almost as likely to view the Democratic Party negatively (81% unfavorable). Opinions among Democrats and Democratic leaners are nearly the mirror image: 88% of Democrats and 84% of Democratic leaners view the GOP unfavorably. In both parties, the shares of partisan identifiers and leaners with unfavorable impressions of the opposition party are at or near all-time highs.
Perhaps more important, intense dislike of the opposing party, which has surged over the past two decades among partisans, has followed a similar trajectory among independents who lean toward the Republican and Democratic parties.
The share of Democratic-leaning independents with a very unfavorable opinion of the Republican Party has more than quadrupled between 1994 and 2018 (from 8% to 37%). There has been a similar trend in how Republican leaners view the Democratic Party; very unfavorable opinions have increased from 15% in 1994 to 39% in 2018.