Survey Report
In the wake of Donald Trump’s 2016 election victory, an overwhelming majority of those who said they had voted for him had “warm” feelings for him.
By this spring, more than a year into Trump’s presidency, the feelings of these same Trump voters had changed very little.
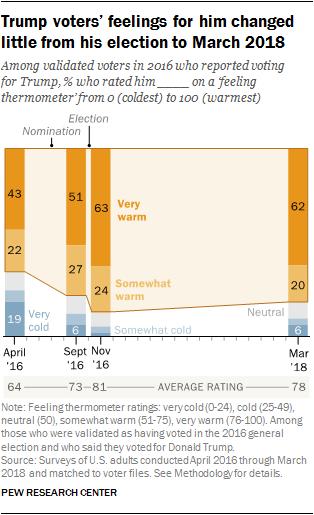
In March, 82% of those who reported voting for Trump – and whom researchers were able to verify through voting records as having voted in 2016 – said they felt “warmly” toward Trump, with 62% saying they had “very warm” feelings toward him. Their feelings were expressed on a 0-100 “feeling thermometer.” A rating of 51 or higher is “warm,” with 76 or higher indicating “very warm” feelings.
The views of these same Trump voters had been quite similar in November 2016: At that time, 87% had warm feelings toward him, including 63% who had very warm feelings.
This report is based on surveys conducted on Pew Research Center’s nationally representative American Trends Panel. The Center tracked views of Trump among the same groups of Americans in March 2018 and at three points in 2016, including in November shortly after the election. In that survey, respondents reported whom they had voted for.
When state voter files – publicly available records of who turned out to vote – became available months after the election, respondents were matched to these files. Self-reported turnout was not used in this analysis; rather, researchers took extensive effort to determine which respondents had in fact voted. And unlike other studies that have employed voter validation, this one employs five different commercial voter files in an effort to minimize the possibility that actual voters were incorrectly classified as nonvoters due to errors in locating their turnout records.
This study also includes a detailed portrait of the electorate – which also is based on the reported voting preferences of validated voters. It casts the widely reported educational divide among white voters in 2016 into stark relief: A majority of white college graduates (55%) reported voting for Hillary Clinton, compared with 38% who supported Trump. Among the much larger share of white voters who did not complete college, 64% backed Trump and just 28% supported Clinton.
Views of Trump among Clinton voters, supporters of other candidates
Many voters who ultimately supported Trump in the general election did not always feel so warmly toward him. In April 2016, shortly before Trump secured the Republican nomination for president, a substantial share of those who would go on to vote for him in November expressed mixed, or even cold, feelings toward him: While most (65%) either viewed him warmly or very warmly, about a third (35%) felt either cold or neutral toward him. About one-in-five (19%) of those who ended up voting for Trump had very cold feelings for him at that time (rating him lower than 25 on the 0-100 scale).
Yet just a few months later, after Trump had wrapped up the GOP nomination and the general election campaign was underway, Trump voters’ feelings toward him grew more positive. And in the wake of his election victory, the feelings of these same Trump voters turned even more positive. In November 2016, 87% of Trump voters said they had warm feelings toward him; and in March of this year, 82% did so.
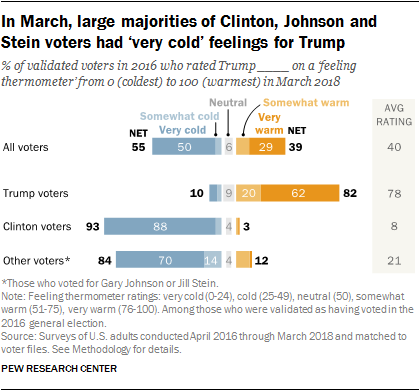
While most Trump voters continued to have very positive feelings for him, Clinton voters – and voters who supported Gary Johnson and Jill Stein – continued to have even more negative views of Trump.
This March, an overwhelming share (93%) of verified voters who had backed Clinton in the 2016 election gave Trump a cold rating, with 88% giving him a very cold rating. Only 3% of those who voted for Clinton felt at all warmly toward Trump. In fact, a majority of Clinton voters (65%) gave Trump the coldest possible rating (0 on the 0-100 scale).
A large majority of verified voters who reported voting for Gary Johnson or Jill Stein in 2016 also viewed Trump very negatively this spring. Among voters who said they voted for either of these candidates, 84% gave Trump a cold rating, with 70% rating him very coldly.
From cold (or neutral) to warm
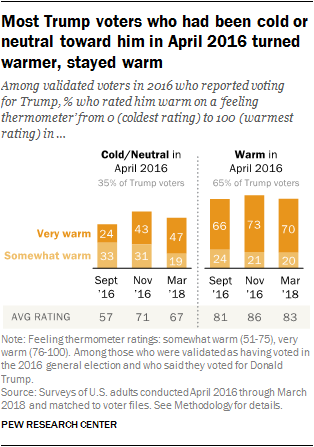
About a third of Trump’s November 2016 voters (35%) had cold or neutral feelings toward him earlier that year. By September 2016, a 57% majority of these voters had warmed to him, including 24% who felt very warmly. And shortly after the election, three-quarters of these once cold or neutral voters (74%) felt warmly toward him, including 43% who rated him very warmly.
Among the 65% majority of Trump voters who felt warmly toward him in April 2016, there was much less change in opinions about him. Of this group, 90% or more maintained warm feelings toward him in September and November 2016.
And among both of these groups of verified voters who cast ballots for Trump in November – those who felt warmly toward Trump in April 2016 and those who did not – opinions about Trump changed little between November 2016 and March 2018.
Four types of Trump voters, based on their views in 2016 and 2018
Comparing Trump voters’ feelings about him in April 2016 with their views in March 2018 divides them into four groups: Enthusiasts, who had warm feelings for Trump at both points; Converts, who were initially cold or neutral but warmed over time; Skeptics, who were cold toward Trump in April 2016 and cold again in March 2018; and Disillusioned Trump voters, who were initially warm toward him but were cold or neutral in March 2018.
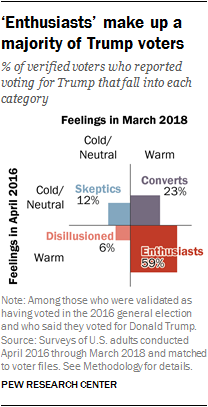
Enthusiasts make up the largest share of Trump voters (59% of verified voters who reported voting for Trump); they gave Trump warm ratings on the feeling thermometer in both April 2016 and March 2018. Their loyalty to Trump was evident in the primary campaign: In April 2016, six-in-ten Enthusiasts (60%) said they wanted to see Trump receive the nomination compared with just 14% of the other groups of Trump general election voters.
Converts make up the next largest share of Trump voters (23%). These voters were cold or neutral toward Trump prior to his receiving the Republican nomination. In April 2016, nearly half of Converts (44%) favored Ted Cruz for the GOP presidential nomination. But in September 2016, during the general election campaign, 73% of this group had warm feelings for Trump, including 31% who gave Trump a very warm rating. By March 2018, 71% gave him a very warm rating.
Skeptics, like Converts, had cold or neutral feelings for Trump in April 2016. Unlike Converts, however, Skeptics did not have warm feelings toward Trump nearly two years later, after he became president. Skeptics, who constitute 12% of Trump voters, reported voting for him, and their feelings for the president became somewhat warmer in the wake of the election. But their views of him grew more negative after he became president.
A very small segment of Trump voters, the Disillusioned, had warm feelings for him in April 2016 – and reported voting for him that November – but had cold or neutral feelings for him in March 2018. The Disillusioned make up just 6% of Trump voters.
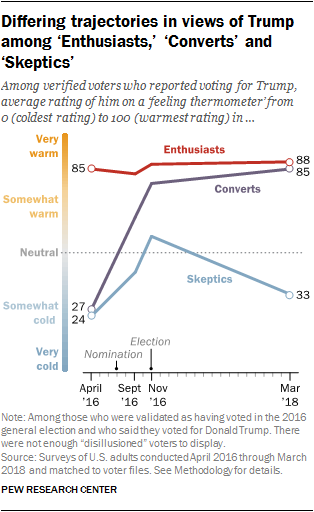
Looking at the average thermometer ratings for Trump from 2016 to 2018 among three groups of Trump voters (there are too few of the Disillusioned for this analysis) underscores the different trajectories in feelings toward Trump among the Converts, Skeptics and Enthusiasts.
In April 2016, the average thermometer ratings for Trump among both Converts and Skeptics were very low (27 among Converts, 24 among Skeptics). By contrast, the average rating among Enthusiasts was 85.
Shortly after the election, both Converts and Skeptics warmed considerably toward Trump, but there were sizable differences in views of the president-elect among the two groups: In November 2016, the average rating for Trump among Converts was 22 points higher than among Skeptics (79 vs. 57).
By March 2018, the average thermometer rating among Converts was 85, slightly higher than it had been shortly after the election. The average rating among Skeptics plummeted more than 20 points (from 57 to 33). The average thermometer rating for Trump among Enthusiasts remained very high over the course of the 2016 campaign and into the second year of Trump’s presidency (88 in March 2018).
In March 2018, modest gender gap in views of Trump among supporters
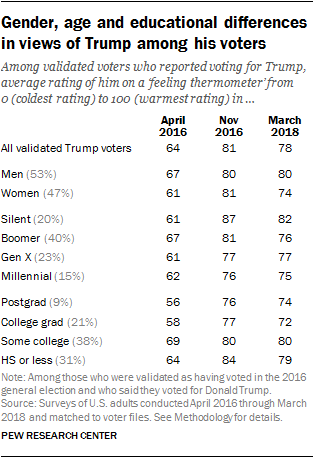
In April 2016, men who ended up voting for Trump gave him somewhat higher average thermometer ratings than did his women supporters. There were no gender differences in November 2016, following the election. But a significant gap is now evident. Among voters who had reported voting for Trump, men gave him an average thermometer rating of 80 in March 2018, unchanged from November 2016. The average rating among women Trump voters was 74, down 7 points from shortly after the election. There were comparable gender differences during the primary campaign in April 2016, when the average rating for Trump was 6 points higher among men (67) than women (61) who said they voted for him.
The oldest Trump voters, those in the Silent Generation (born 1928-1945), gave him the highest average thermometer ratings in March of this year (82) and in November 2016 (87). There were more modest generational differences in April of that year.
Trump voters without a four-year college degree have rated him consistently higher on the thermometer than have his supporters with a four-year college degree or more advanced education. In March of this year, the average rating among Trump voters who had not completed college was 80, compared with 72 among college graduates.


