The demographic profile of voters has changed markedly in recent years, reflecting broader changes in the nation. The electorate is more racially and ethnically diverse than in the past. Voters also are older and better educated than they were two decades ago.
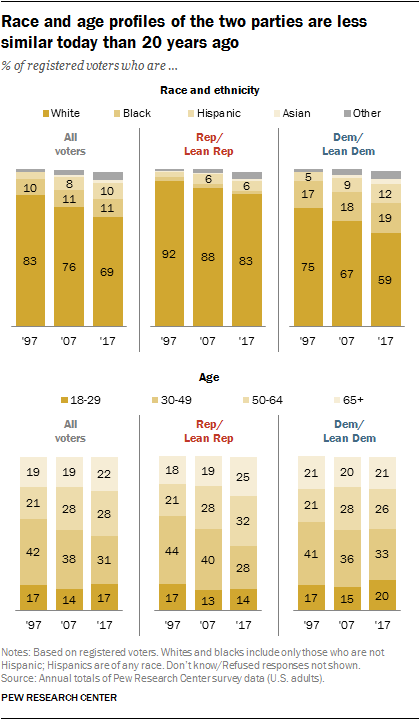
Overall, while non-Hispanic whites remain the largest share of registered voters (69%), their share is down from 83% in 1997. African Americans make up 11% of voters, a share that has changed little since then.
Hispanics constitute a much larger share of registered voters today (10%) than in the late 1990s (4% in 1997), though there has been relatively little change over the past decade. Asian Americans, who made up a tiny share of voters 20 years ago, now constitute 2% of voters. And voters who describe their race as “other” also make up a larger share of the electorate than in the past (5% today).
The overall growth in the racial and ethnic diversity of voters has changed the composition of both the Republican and Democratic parties. Yet the pace of change has been more pronounced among Democrats and Democratic leaners.
White registered voters make up a declining share of the Democratic Party. In 1997, 75% of Democratic and Democratic-leaning registered voters were white; that has dropped to a smaller majority today (59%). Nonwhite voters now make up about four-in-ten Democratic voters (39%), up from 24% in 1997.
Republican and Republican-leaning voters continue to be overwhelmingly white: 83% of Republican registered voters are white non-Hispanics, compared with 92% in 1997. The share of Republicans who are nonwhite increased from 8% to 14% over this period.
The electorate continues to grow older, impacting the age composition of Democratic and Republican voters. In 1997, the median age of all registered voters was 45; today the median age has risen to 50.
Nearly six-in-ten Republican and Republican-leaning voters (57%) are ages 50 and older, compared with 42% who are under 50. Among Democratic voters, a larger share are younger than 50 (53%) than 50 and older (46%).
Twenty years ago, the age profiles of the two parties were much more similar. At that time, comparable majorities of both parties’ voters were younger than 50 (61% of Republicans, 57% of Democrats).
In 1997, the median age of Republican voters was 43, while the median age of Democratic voters was 46. Today, the median age of Republican voters has increased nine years, to age 52, while the median age of Democratic voters has edged up to 48.
Parties’ educational profiles diverge
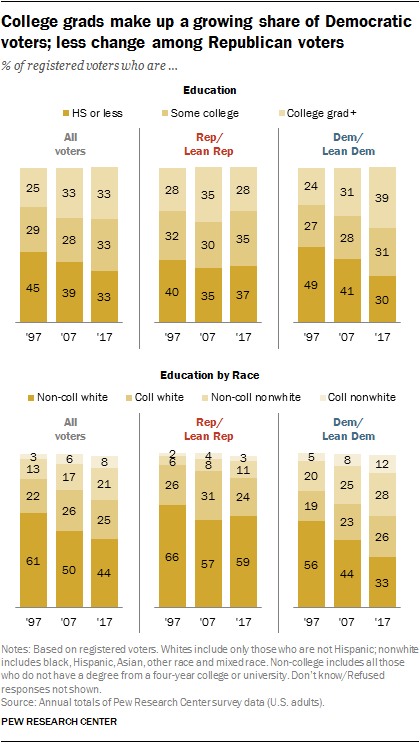
Over the past 20 years, the American electorate has become better educated, with the share of college graduates rising. In 1997, 45% of all registered voters had no college experience; today that share has fallen to 33%.
And while those with no college experience was the largest category of voters two decades ago, today the electorate is evenly divided – a third each are college graduates, have some college experience but no degree and have no more than a high school diploma.
Despite these shifts, Republican and Republican-leaning voters are no more likely to be college graduates than was the case two decades ago. And college graduates make up a smaller share of GOP voters than they did a decade ago.
Today, 28% of Republican voters have at least a four-year college degree; 35% have some college experience but no degree; and 37% have no college experience.
The educational composition of GOP voters is similar to what it was in 1997. At that time, 28% were at least college graduates; 32% had some college experience; and 40% had no more than a high school education. And in 2007, college graduates made up a greater share of Republican voters than is currently the case (35% of all GOP voters then, 28% now).
The educational makeup of Democratic voters has changed substantially over the past 20 years. Today, about four-in-ten Democrats (39%) have at least a college degree, up from 24% in 1997. And while voters with no more than a high school education constituted the largest share of Democratic voters 20 years ago, today college graduates make up the largest share.
Whites without a college degree remain the largest share of all registered voters, but their numbers have been on the decline due to growing diversity and rising levels of education in the population. In 1997, a majority of all registered voters (61%) were whites without a college degree. Over the past 20 years, that share has fallen to 44%.
The share of whites with at least a college degree has edged up from 22% of registered voters in 1997 to 25% today. Among nonwhites, the share with a college degree or more education has more than doubled, from just 3% in 1997 to 8% in 2017. And nonwhites without a college degree make up a much larger proportion of the electorate today (21%) than 20 years ago (13%).
Combining race and education, Democratic voters are very different today than they were 20 years ago. Today, non-college whites make up a third of all Democratic voters; they constituted a majority of Democrats (56%) in 1997. Since then, the share of white Democrats with at least a four-year degree has increased from 19% to 26%, and the share of nonwhite Democratic college graduates has more than doubled (from 5% to 12%).
Whites who do not have a four-year college degree continue to make up a majority of Republican voters, though a smaller majority than 20 years ago (59% now, 66% then). Whites with at least a four-year degree constitute about a quarter of Republican voters (24%), little changed from 1997 (26%).
Religiously unaffiliated voters make up increasing share of Democrats
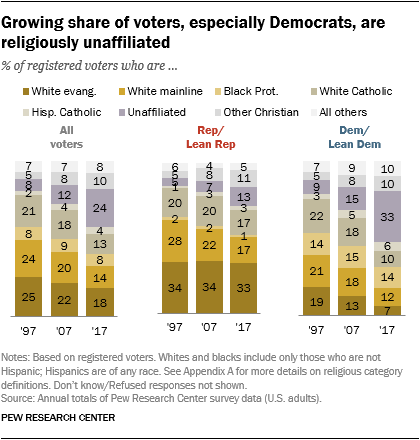
CORRECTION (Jan. 2, 2019): In the chart “Growing share of voters, especially Democrats, are previously unaffiliated,” the percentages of registered voters who are “other Christian” and “all others” have been updated to correct a data tabulation error.
The nation’s religious landscape has undergone major changes in recent years, with the share of the population who identify as Christian declining as the number of adults who do not identify with a religion has grown.
Religiously unaffiliated voters, who made up just 8% of the electorate two decades ago, now constitute about a quarter (24%) of all registered voters. Over this period, there have been declines in the shares of white mainline Protestants, white evangelical Protestants and white Catholics.
Religiously unaffiliated voters now account for a third of Democratic voters, up from just 9% in 1997. In fact, they make up a larger proportion of Democrats than do white Protestants (33% vs. 18%). In 1997, 40% of Democratic voters identified as white Protestants (evangelical or mainline), while just 9% were religiously unaffiliated. And white Catholics, who made up about one-in-five Democrats then (22%), account for only 10% of Democrats now.
Republicans continue to be mostly made up of white Christians: A third of Republican voters are white evangelical Protestants, which is little changed from 1997 (34%); 17% are white mainline Protestants (28% in 1997); and 17% are white Catholics (20% then).
While religiously unaffiliated voters constitute a much smaller segment of Republican than Democratic voters, the share of Republicans who do not identify with a religious denomination has risen. Currently, 13% of Republicans do not identify with a religion, up from 5% two decades ago.


