The political typology groups vary substantially in perceptions of financial well-being, as well as in their community preferences and leisure pursuits. From whether they enjoy hunting or reading books to the various ways they access television, these differences help paint a portrait of a changing nation.
There are stark divides across the typology groups in income and wealth, and to some degree these gaps are reflected in assessments of personal finances. Among Disaffected Democrats and Devout and Diverse – which have the lowest family incomes among the typology groups – fewer than four-in-ten say they are generally satisfied with their finances (37% of Disaffected Democrats, 35% of Devout and Diverse). Among other groups, about half or more express satisfaction with their personal finances.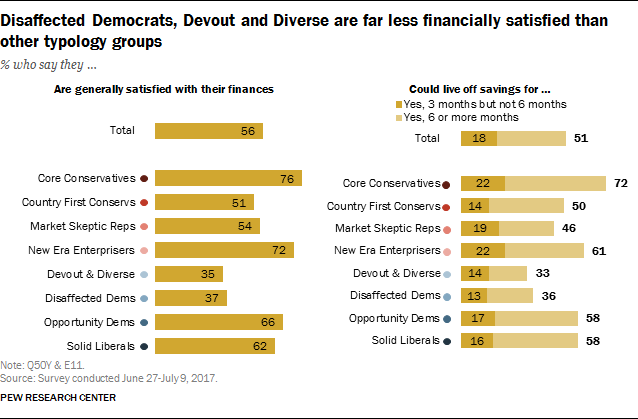
However, while Core Conservatives and Solid Liberals have the highest family incomes among typology groups (about half in each group have incomes of at least $75,000), more Core Conservatives than Solid Liberals express satisfaction with their personal finances (76% vs. 62%).
And while New Era Enterprisers are not nearly as affluent as these two groups (just a third have family incomes of $75,000 or more), a relatively large share (72%) are satisfied financially.
Assessments of personal financial security – the length of time people estimate they can live off of their savings – track closely with the measure of financial satisfaction. Core Conservatives are most likely to say they could live off of their savings for at least three months (72% say they are able to do this). Just 36% of Disaffected Democrats and 33% of Devout and Diverse say they would be able to survive on their savings that long.
When it comes to employment, more than half of U.S. adults (58%) report being employed and not looking for more, meaning they are either fully employed or employed part-time but not seeking additional employment. Another 28% of adults report being 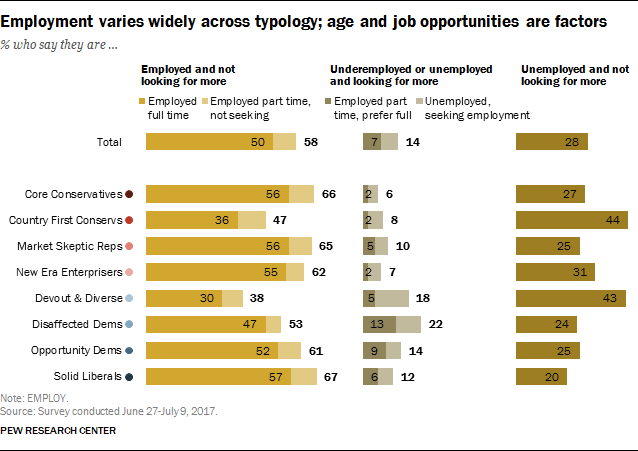 unemployed, but say they are not looking for additional employment. However, 14% of Americans are underemployed; whether they are unemployed or employed part time, this group is unhappy with their employment status and looking for more.
There are wide disparities in the shares of typology groups who say they are working. In part, these differences are attributable to age. Among Country First Conservatives, 71% of whom are ages 50 and older, only about half (47%) report being fully employed or employed part-time and not looking for work. But relatively few in this group – just 8% – report they are underemployed; 44% say they are not employed and not looking for work.
This stands in contrast to Disaffected Democrats, who are relatively young (37% are 50 and older). Just 53% in this group say they are employed and not looking for work, which is comparable to the Country First Conservatives. But among the younger Disaffected Democrats, nearly three times as many report that they are underemployed (22% vs. 8%).
The two ideological anchors of the political typology, Solid Liberals and Core Conservatives, include large shares of people who are working and not looking for work (67% of Solid Liberals and 66% of Core Conservatives).
Home ownership, investments, passports
Core Conservatives are most likely to own their homes; 86% say they own a home, more than 10 percentage points higher than any other typology group.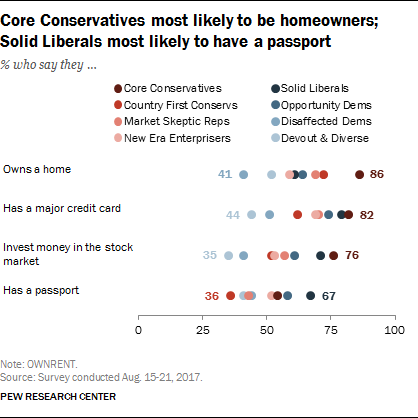
Core Conservatives, along with Solid Liberals, also are most likely to have a major credit card and to invest money in the stock market, including retirement accounts like IRAs or 401(k)s.
About eight-in-ten Core Conservatives (82%) and Solid Liberals (79%) say they have a major credit card. Comparable shares of both groups (76% of Core Conservatives, 71% of Solid Liberals) say they have investments in the stock market.
Significantly smaller shares of the two most financially stressed typology groups, Disaffected Democrats and Devout and Diverse, say they own homes, have credit cards and have market investments.
When it comes to having a passport, however, Solid Liberals stand out. Two-thirds of Solid Liberals (67%) say they have a passport, the highest share of any typology group. By contrast, just 36% of Country First Conservatives have a passport, the lowest share of any group.
Where people prefer to live – and where they actually live
When it comes to the types of communities where people want to live, Americans are divided between wanting to live in a community where houses are larger but 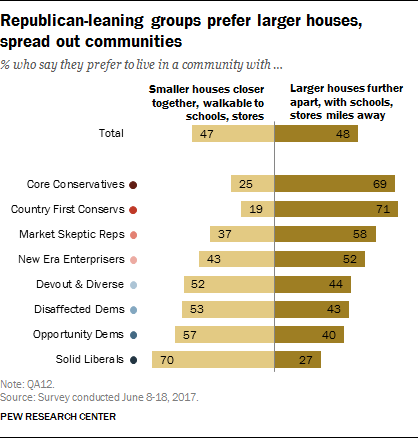 farther apart and one where houses are smaller but closer together.
These preferences are divided along partisan and ideological lines. Large majorities in the two most conservative groups in the political typology – Core Conservatives (69%) and Country First Conservatives (71%) – would prefer a community where there are larger houses that are farther apart, even if it meant schools, stores and restaurants were several miles away.
An equally large majority of Solid Liberals (70%) say they would prefer a community where houses are smaller and closer together, with stores and restaurants within walking distance. Other typology groups are more divided, with Democratic groups generally opting for smaller houses in walkable communities, and Republican groups preferring larger houses in communities that are more spread out.
When it comes to communities where people actually live, more people live in a suburban area (49%) 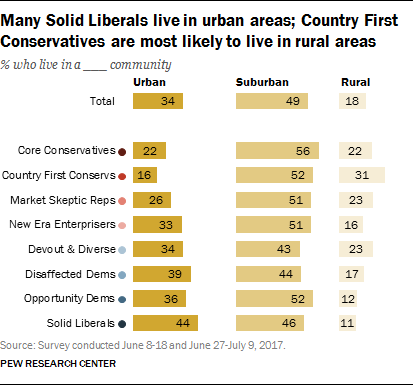 than in urban (34%) or rural areas (18%) – and this is true across most typology groups. However, among Solid Liberals, nearly equal shares live in urban (44%) and suburban (46%) communities. And while among Republican groups about half or more live in the suburbs, Country First Conservatives are most likely to live in rural areas (31%).
Regardless of the type of community where they grew up, many Americans say they have lived in their local community their entire life.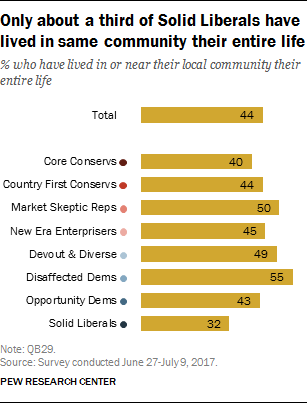
This is particularly pronounced among Disaffected Democrats (55%) and Market Skeptic Republicans (50%), more than half of whom have never moved away from the community where they grew up.
By contrast, just about a third (32%) of Solid Liberals have lived in the same community their entire lives.
Solid Liberals most likely to take public transportation
The types of communities in which people live have a major impact on their transportation options. Most Americans (70%) say they rarely, if ever, use public transportation. About 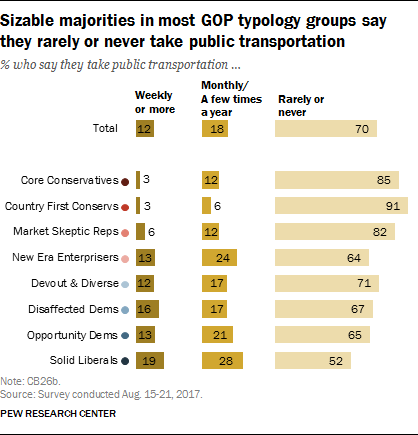 two-in-ten (18%) say they use public transportation between once or twice a month and a few times a year, while just 12% say they use it at least once a week.
Public transit use is higher on the left than the right, particularly among groups with higher shares living in urban areas.
About half (47%) of Solid Liberals say they use public transportation at least a few times a year, including 19% who use it at least once a week.
Access to public transportation plays a role in use. For example, while 91% of Country First Conservatives have rarely or never taken public transportation, just 16% of that group lives in an urban area where such transportation options are most prevalent. By comparison, New Era Enterprisers are more likely than other Republican groups to live in urban areas and they also have the highest rate of public transit use among GOP-leaning typology groups.
Drug addiction has impacted GOP and Democratic groups alike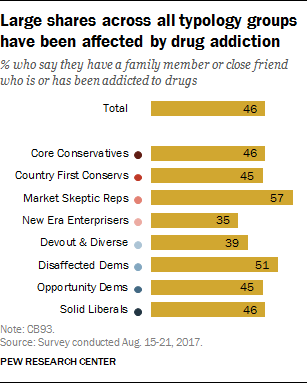
Drug addiction has touched the lives of millions of Americans. Overall, nearly half of the public (46%) say they have a family member of close friend who is or has been addicted to drugs.
Among typology groups, Market Skeptic Republicans (57%) and Disaffected Democrats (51%) are most likely to say a friend or family member has been addicted to drugs.
But this experience is relatively commonplace even among affluent typology groups – 46% of Core Conservatives and Solid Liberals report they have a friend or family member who has been addicted to drugs.
When it comes to another public health issue, cigarette smoking, 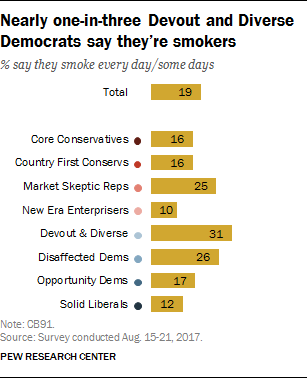 relatively large shares of the two groups with the lowest family incomes – Devout and Diverse (31%) and Disaffected Democrats (26%) – say they smoke at least sometimes. However, about as many Market Skeptic Republicans (25%) say they smoke that often.
While some right-leaning groups are less likely to be current smokers, many report being former smokers. Just 16% of Country First Conservatives say they are current smokers, but 40% of this group say they used to smoke regularly. And while just 10% of New Era Enterprisers say they regularly smoke now, another 32% say they used to smoke.
Educational differences among typology groups
The educational levels among typology groups vary widely, and there are sharp educational differences within each party’s coalition.
Solid Liberals include by far the highest share of college graduates: 57% have at least a four-year degree, while 29% have postgraduate degrees. By contrast, the Democratic-leaning Devout and Diverse have the least amount of educational experience (56% have a high school degree or less).
Similar, though less stark, contrasts exist between Republican-leaning groups: A third of Core Conservatives have completed college, compared with 16% of Country First Conservatives. 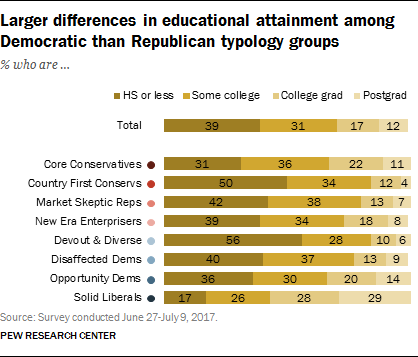
Majorities of college graduates within all typology groups say most of their friends have a college degree. Those in Democratic-leaning groups are only slightly more likely to say this than those in Republican-leaning groups.
Among those without a college degree, there is more variation in the share who say their friends have completed college. More than four-in-ten Solid Liberals who do not have a college degree (42%) say most of their friends have completed college, the highest share among typology groups. By contrast, among Devout and Diverse who do not have college degrees, just 17% say most of their friends have finished college.
Among Republican-leaning groups, 58% of Core Conservatives without a college degree say their close friends are a mix of those with and without a college degree, while 23% say most of their close friends have graduated college and 18% say most do not have a college degree. Those without a college degree in the other Republican-leaning typology groups are somewhat more likely than Core Conservatives to say most of their friends do not have a college degree: Roughly three-in-ten say this.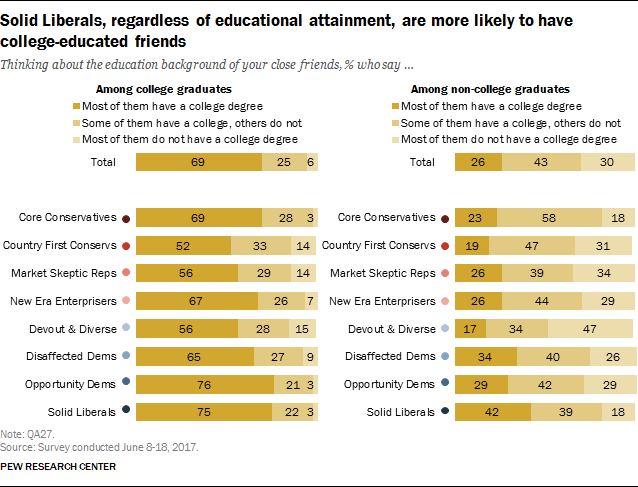
Military service, union membership
One-in-ten Americans (10%) have served in the military. This is more common among Republican-leaning groups like Core Conservatives 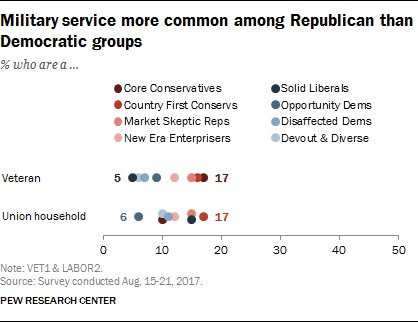 (17%), Country First Conservatives (16%) and Market Skeptic Republicans (15%). By contrast, all four left-leaning groups have lower shares of veterans, with only 5% of Solid Liberals reporting they previously served in the military.
While labor unions have traditionally been more Democratic-leaning institutions, many in right- and left-leaning typology groups report being members. Sizable shares of Country First Conservatives (17%), Solid Liberals (15%) and Market Skeptic Republicans (15%) say they are members of a labor union. By contrast, just 6% of Opportunity Democrats say they are union members.
Wide differences in interests and activities
Aside from their political differences, Democrats and Republicans also tend to enjoy different activities and interests. Activities such as reading books and going to museums are generally more widely enjoyed among 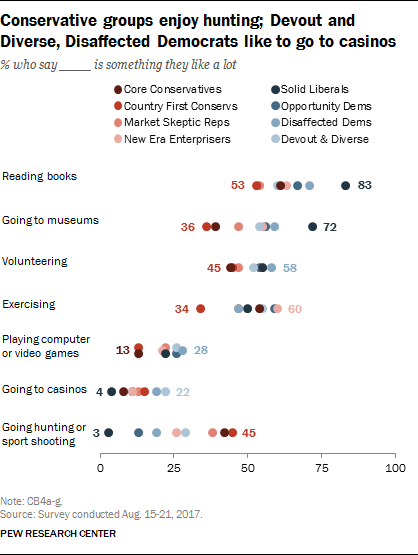 Democratic-leaning groups. By contrast, Republican leaning groups are more likely to say they like hunting or sport shooting than their Democratic-leaning counterparts.
About seven-in-ten Solid Liberals (72%) say they like going to museums a lot. Smaller majorities of other Democratic groups also say they enjoy museums a great deal.
By contrast, just 36% of Country First Conservatives and 39% of Core Conservatives say they like going to museums a lot.
Among Country First Conservatives, 45% say they like hunting or sport shooting a lot. Similar shares of Core Conservatives and Market Skeptic Republicans also say this. However, just 3% of Solid Liberals say they like hunting or sport shooting a lot.
Volunteering garners more bipartisan interest. About six-in-ten Disaffected Democrats (58%) say they like volunteering a lot. Similar shares of most other groups, including New Era Enterprisers, Devout and Diverse, and Market Skeptic Republicans say this.
Devout and Diverse and Disaffected Democrats are more likely than other groups to say they enjoy going to casinos a lot (22% and 19%, respectively). Much smaller shares of the two typology groups with the highest family incomes, Core Conservatives (8%) and Solid Liberals (4%) say they enjoy casinos a great deal.
Technology use
Americans are split when it comes to whether they could live without a cellphone: About as many say they can’t imagine living without their cellphone as say that they could live without it (30% and 31%, respectively). A slightly higher share (38%) say they “would miss it, but could probably live without a cellphone.”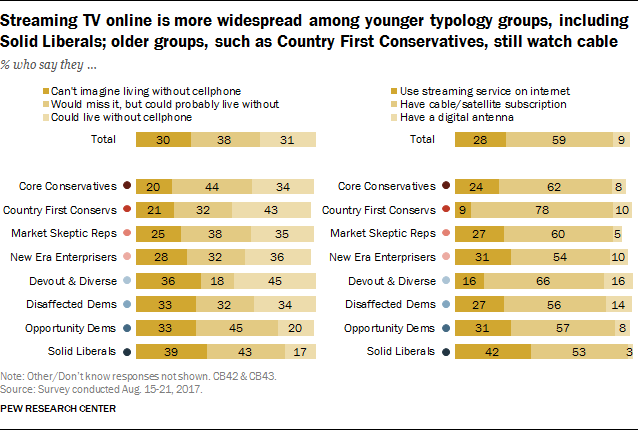
Higher shares of those in Democratic-leaning groups than Republican-leaning groups say they could not imagine living without their cellphones. Fully 39% of Solid Liberals say this (just 17% say they are OK living without their phones).
By contrast, 43% of Country First Conservatives say they could live without their cellphones. Just 20% say they can’t imagine living without their cellphones.
When it comes to how Americans watch television, Democratic-leaning typology groups, particularly Solid Liberals, are more likely than Republican-leaning groups to use streaming services to watch television rather than traditional cable.
Four-in-ten Solid Liberals (42%), who are among the youngest typology groups, use streaming services as their primary mode of watching television. Just 9% of Country First Conservatives – the oldest typology group – say they do this.

 Find out which of the types is your best match
 Comparing Political Typology groups
 Facebook live: Political typology discussion