Surveys conducted June 8-18, 2017 and June 27-July 9, 2017
Most of the analysis in this report is based on two telephone surveys conducted June 8-July 9, 2017. The first survey includes interviews conducted June 8-18, 2017 among a national sample of 2,504 adults, 18 years of age or older, living in all 50 U.S. states and the District of Columbia (628 respondents were interviewed on a landline telephone, and 1,876 were interviewed on a cell phone, including 1,109 who had no landline telephone). The second survey includes interviews conducted June 27 – July 9, 2017 among a national sample of 2,505 adults, 18 years of age or older, living in all 50 U.S. states and the District of Columbia (627 respondents were interviewed on a landline telephone, and 1,878 were interviewed on a cell phone, including 1,148 who had no landline telephone). These surveys were conducted by interviewers at Princeton Data Source under the direction of Princeton Survey Research Associates International. A combination of landline and cell phone random digit dial samples were used; all samples were provided by Survey Sampling International. Interviews were conducted in English and Spanish. Respondents in the landline sample were selected by randomly asking for the youngest adult male or female who is now at home. Interviews in the cell sample were conducted with the person who answered the phone, if that person was an adult 18 years of age or older. For detailed information about our survey methodology, see https://www.pewresearch.org/methodology/u-s-survey-research/
The combined landline and cell phone samples are weighted using an iterative technique that matches gender, age, education, race, Hispanic origin and nativity and region to parameters from the 2015 Census Bureau’s American Community Survey and population density to parameters from the Decennial Census. The samples also are weighted to match current patterns of telephone status (landline only, cell phone only, or both landline and cell phone), based on extrapolations from the 2016 National Health Interview Survey. The weighting procedure also accounts for the fact that respondents with both landline and cell phones have a greater probability of being included in the combined sample and adjusts for household size among respondents with a landline phone. The margins of error reported and statistical tests of significance are adjusted to account for the surveys’ design effects, a measure of how much efficiency is lost from the weighting procedures.
The following table shows the unweighted sample sizes and the error attributable to sampling that would be expected at the 95% level of confidence for different groups in the surveys:
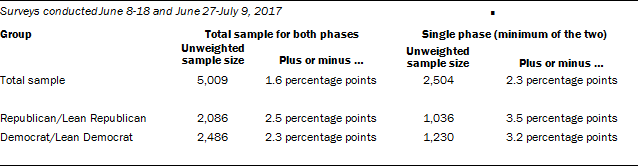
Sample sizes and sampling errors for other subgroups are available upon request.
In addition to sampling error, one should bear in mind that question wording and practical difficulties in conducting surveys can introduce error or bias into the findings of opinion polls.
Survey conducted August 15-21, 2017
The analysis in this report also is based on telephone interviews conducted Aug. 15-21, 2017 among a national sample of 1,893 adults. The interviews were conducted among adults 18 years of age or older previously interviewed in one of two Pew Research Center surveys conducted June 8-18, 2017, of 2,504 adults and June 27-July 9, 2017, of 2,505 adults. The survey was conducted by interviewers at Princeton Data Source under the direction of Princeton Survey Research Associates International. Interviews were conducted on both landline telephones and cell phones (517 respondents for this survey were interviewed on a landline telephone, and 1,376 were interviewed on a cell phone). Interviews were conducted in English and Spanish. Interviewers asked to speak with the respondent from the previous interview by first name, if it was available, or by age and gender. For detailed information about our survey methodology, see https://www.pewresearch.org/methodology/u-s-survey-research/
Weighting was performed in two stages. The weight from the original sample datasets was used as a first-stage weight for this project. This first-stage weight corrects for different probabilities of selection and differential non-response associated with the original interview. The sample of all adults contacted for this survey was then raked to match parameters for sex by age, sex by education, age by education, region, race/ethnicity, population density, phone use. The non-Hispanic, white subgroup was also raked to age, education and region. These parameters came from the 2015 Census Bureau’s American Community Survey and population density to parameters from the Decennial Census. The sample also is weighted to match current patterns of telephone status (landline only, cell phone only, or both landline and cell phone), based on extrapolations from the 2016 National Health Interview Survey. Sampling errors and statistical tests of significance take into account the effect of weighting.
The following table shows the unweighted sample sizes and the error attributable to sampling that would be expected at the 95% level of confidence for different groups in the survey:
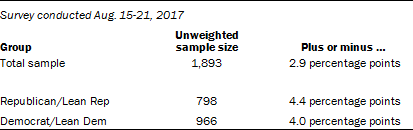
Sample sizes and sampling errors for other subgroups are available upon request.
In addition to sampling error, one should bear in mind that question wording and practical difficulties in conducting surveys can introduce error or bias into the findings of opinion polls.
Ideological consistency scale
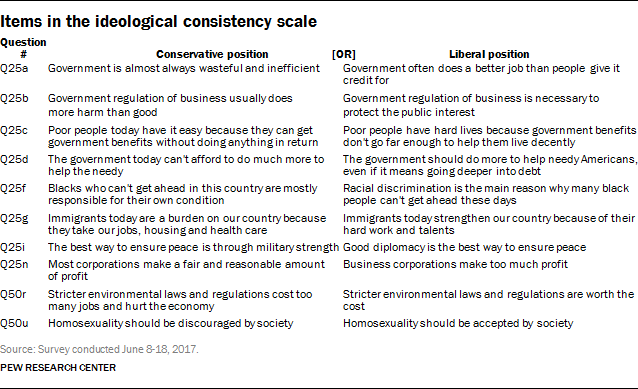
Chapter 1 of this report utilizes a scale composed of 10 questions asked on Pew Research Center surveys going back to 1994 to gauge the extent to which people offer mostly liberal or mostly conservative views across a range of political value dimensions. In short, while there is no ex-ante reason for people’s views on diverse issues such as the social safety net, homosexuality and military strength to correlate, each of these views have a traditional “left/right” association, and the scale measures this growing association over time.
The individual questions in the scale are shown here. Each question was recoded as follows: “-1” for a liberal response, “+1” for a conservative response, “0” for other (don’t know/refused/volunteered) responses. As a result, scores on the full scale range from -10 (liberal responses to all 10 questions) to +10 (conservative responses to all 10 questions). The graphics use the full set of points on the scale (note that graphics in chapter 1 are smoothed by showing the average of two consecutive points on the scale). For additional detail about the scale, see Appendix A of Pew Research Center’s 2014 report on political polarization.
Pew Research Center undertakes all polling activity, including calls to mobile telephone numbers, in compliance with the Telephone Consumer Protection Act and other applicable laws.
Pew Research Center is a nonprofit, tax-exempt 501(c)(3) organization and a subsidiary of The Pew Charitable Trusts, its primary funder.
