The analysis in this report is based on a survey conducted from March 25 to April 19, 2016, among a national sample of 3,763 U.S. citizens, 18 years of age or older, living in all 50 states and the District of Columbia. The survey was conducted by the GfK Group using KnowledgePanel, its nationally representative online research panel. Survey respondents’ vote histories, including their 2016 record of voting (or not), were appended using a commercial national voter file (detailed below); 3,309 respondents were successfully matched to the voter file. The analysis in this report is based on the 2,758 respondents who were matched to the voter file, listed as registered voters and were old enough to vote in the 2012 election (age 22 or older in 2016).
KnowledgePanel members are recruited through probability sampling methods and include those with internet access and those who did not have internet access at the time of their recruitment (KnowledgePanel provides internet access for those who do not have it, and if needed, a device to access the internet when they join the panel). A combination of random-digit dialing (RDD) and address-based sampling (ABS) methodologies have been used to recruit panel members (in 2009 KnowledgePanel switched its sampling methodology for recruiting members from RDD to ABS). The panel includes households with landlines and cellular phones, including those only with cell phones and those without a phone. Both the RDD and ABS samples were provided by Marketing Systems Group (MSG). KnowledgePanel continually recruits new panel members throughout the year to offset panel attrition as people leave the panel. The survey was conducted in English and Spanish.
All active members of the GfK panel were eligible for inclusion in this study. In all, 25,369 panelists were invited to take part in the survey. All sampled members received an initial email to notify them of the survey and provide a link to the survey questionnaire. Additional follow-up reminders were sent to those who had not yet responded as needed. In total, 14,474 panelists completed a brief screening questionnaire, including questions about citizenship (screening out non-citizens) and self-reported voting frequency. To support reliable analysis of Americans who seldom or never vote, self-identified infrequent voters were sampled for the extended interview at a higher rate than frequent voters.
The weighting for this study was computed in stages. First, GfK created screener weights based on all screened respondents who are US citizens (with valid registered to vote/voting status from field) The screened sample was weighted using an iterative technique that matches the sample’s distribution for gender, age, race, Hispanic origin, education, region, household income, home ownership status and metropolitan area to the parameters of the Census Bureau’s November 2014 Current Population Survey (CPS) Voting Supplement estimates for U.S. adult citizens. In addition, the sample was weighted to match patterns of internet access from the Current Population Survey. This weight is multiplied by an initial sampling or base weight that corrects for differences in the probability of selection of various segments of GfK’s sample and by a panel weight that adjusts for any biases due to nonresponse and noncoverage at the panel recruitment stage (using all of the parameters described above). Details about the GfK panel-level weights can be found in this document.
Next, GfK used the weighted screener data to compute geo-demographic benchmarks for each of the five voting groups. Then the screener respondents who did not qualify for the extended interview were dropped. The sample of 3,763 extended interview respondents was then weighted to align with those group-specific benchmarks. These two steps were necessary because there are no benchmarks from federal surveys for the demographic profile of adults citizens who, for example, vote in “almost every election – may have missed one or two.” The approach implemented here uses the CPS to the extent possible, and then uses weighted screener data to estimate population benchmarks that are otherwise unavailable. The weighting protocol also accounts for the differential sampling of the voter groups, such that in the weighted estimates, each voter group is represented proportional to its actual size. The final weight was trimmed at approximately the 1st and 99th percentiles.
The data was not subsequently weighted among those matched to the voter file. If citizens who are matched to the file are systematically different from those who are not matched on the questions examined in this study, then the survey results may contain some error. Because the match rate was relatively high (88%), we expect that the risk of meaningful bias is low.
The following table shows the unweighted sample sizes among panelists who were matched to the voter file, registered to vote and age 22 or older and the error attributable to sampling that would be expected at the 95% level of confidence for different groups in the survey:
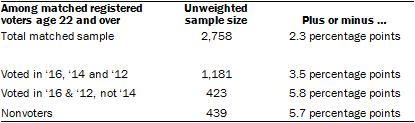
Sample sizes and sampling errors for other subgroups are available upon request.
In addition to sampling error, one should bear in mind that question wording and practical difficulties in conducting surveys can introduce error or bias into the findings of opinion polls.
Voter file matching
The names and addresses of most panelists were gathered by GFK and used to match respondents from the survey sample to their corresponding record in a national voter file. The voter file, gathered by TargetSmart from publicly available individual voter lists from each state, contains information on most voters’ turnout history and selected demographic information (note that the voter file does not indicate for which candidate a person voted, only whether they turned out in that election). To match panelists to the voter file, TargetSmart first looked for exact matches using name, address and demographic characteristics. A second attempt was made with proximity matching, where a radius is drawn around the given address to test slight variations on the match.
Pew Research Center is a nonprofit, tax-exempt 501(c)(3) organization and a subsidiary of The Pew Charitable Trusts, its primary funder.


