Survey Report
The 2018 midterm elections will be determined in large part by who goes to the polls and who stays home. Historically, far fewer Americans turn out to vote in midterm than presidential elections and in 2014, turnout hit a 70-year low.
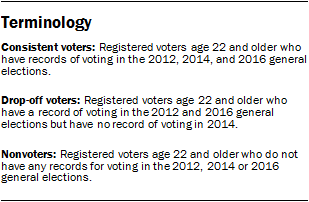
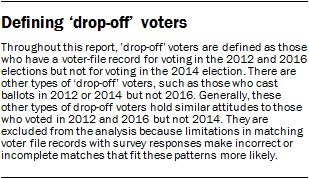
A new Pew Research Center analysis finds that “drop-off” voters – those who voted in the 2012 and 2016 presidential elections but not the 2014 midterm, differed in many ways from consistent voters, who voted in all three of these elections, and nonvoters. In this report, nonvoters are those who were registered to vote, but did not cast ballots in any of the most recent national elections.
To understand these differences, this study combines people’s voting histories (from a national voter file, recently updated to include vote history from the 2016 election) with their attitudes about politics and civic engagement, based on a nationally representative survey conducted in the spring of last year.
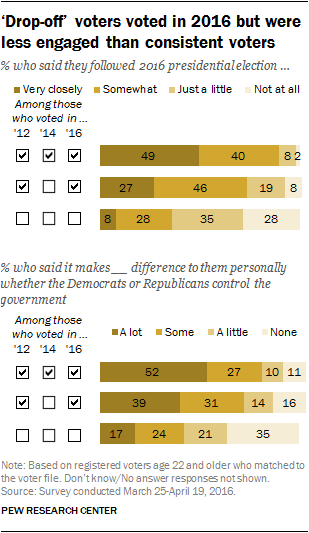
Even in 2016, a presidential election year when these midterm “drop-off” voters turned out and cast ballots, they were considerably less engaged than 2016 voters who had also voted in the 2014 midterm.
In the survey, conducted in March and April during the presidential primaries, just 27% of drop-off voters said they were following the 2016 election very closely, compared with 49% of consistent voters. And drop-off voters were less likely than consistent voters to say that it made a lot of difference to them which party controlled the government; just 39% of drop-off voters said it mattered a lot whether Democrats or Republicans controlled the government, compared with 52% of consistent voters.
Drop-off voters, who had no record of voting in the 2014 congressional elections, were especially likely to place low importance on last year’s elections for the House. Over 8-in-10 drop-off voters (85%) said they personally cared a good deal who won the 2016 presidential election. But only half (50%) said they cared a good deal who won in their own House district.
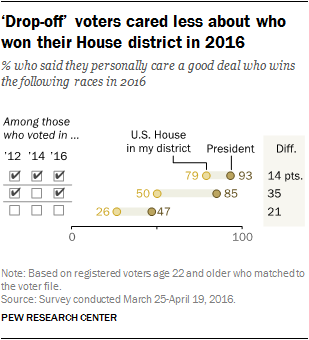
By contrast, overwhelming majorities of consistent voters said both elections mattered a good deal: 93% said that about the presidential election, while 79% said they personally cared a good deal about who won local House election.
Nonvoters were far less likely to view either the presidential election or the House election as important. About half (47%) said they personally cared a good deal who won the presidential election; just 26% said it mattered who won the House election in their district.
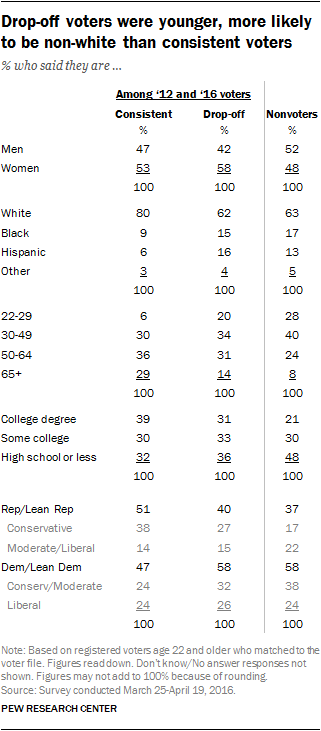
The study also finds wide demographic and socio-economic differences between consistent voters, drop-off voters and nonvoters. For instance, 80% of those who voted in all three elections were non-Hispanic whites, compared with 62% of drop-off voters and 63% of nonvoters. A 65% majority of consistent voters were 50 and older; just 45% of drop-off voters and 32% of nonvoters were 50 and older.
And among members of both parties, consistent voters were much more likely than drop-off voters or nonvoters to say that their household’s financial situation enabled them to “live comfortably.”
This analysis is based on a nationwide survey conducted online among 3,763 adults March 25-April 19, 2016. Of the total sample, it was possible to match the voting records of 3,309 registered voters from voter file records compiled by TargetSmart. This analysis is further restricted to the 2,758 registered voters 22 and older in 2016 (those old enough to have been eligible to vote in 2012). For further details about the survey and the match to the voter file, see the methodology.
The survey was commissioned by The Pew Charitable Trusts; Pew Research Center is a subsidiary of The Pew Charitable Trusts. 1
A voter file is a compilation of data gathered from publicly available voter lists from each state and standardized by a vendor, containing information on turnout history. The voter file does not indicate the candidates for whom a person voted, only whether they have a record of having voted in that election.
Matching the voter file to our survey data allows us to incorporate past turnout history by validating whether panel respondents were recorded as having cast a ballot in the 2012, 2014 or 2016 elections. This validation is an improvement on survey-based estimates of turnout because respondents often have difficulty accurately reporting their participation at the polls. However, it is also true that a known error is introduced when using the voter file. While the presence of a record of voting almost certainly means that a person voted, the absence of a record does not necessarily mean that the person did not vote.
Most drop-off voters saw importance of community issues, volunteering
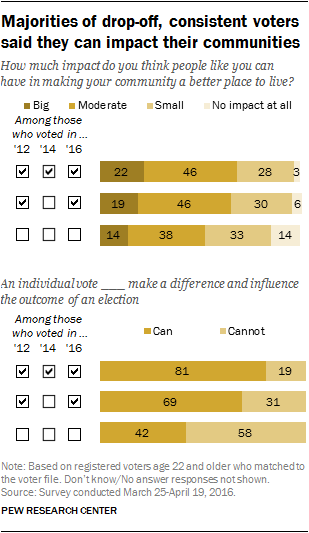
Despite being less interested in politics, drop-off voters were about as likely as consistent voters to say that people like them are able to improve their local communities, and most drop-off voters said an individual’s vote matters. In this sense, they stand out clearly from nonvoters.
About two-thirds of consistent (68%) and drop-off voters (64%) said people like them could have a big or moderate impact in making their community a better place to live. Only about half of nonvoters (53%) say the same.
About eight-in-ten consistent voters (81%) said individual votes can make a difference and influence an election. A somewhat smaller majority (69%) of those who missed the 2014 midterm but turned out in 2012 and 2016 said the same. By contrast, fewer than half nonvoters (42%) – who did not cast ballots in 2012, 2014 or 2016 – said a person’s vote can make a difference.
When it comes to opinions about the actions associated with good citizenship, drop-off voters and consistent voters had some common ground – but largely in non-political realms.
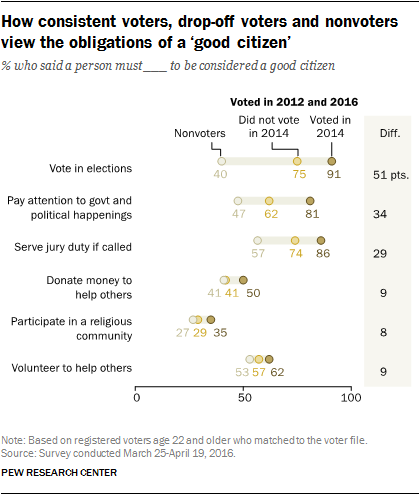
For instance, comparable shares of drop-off voters (57%) and consistent voters (62%) said a person must volunteer to help others to be considered a good citizen. There also were only modest gaps on the importance of charitable giving and participation in a religious community.
But while 91% of consistent voters said voting in elections was integral to good citizenship, a smaller majority (75%) of drop-off voters said this. Fewer drop-off voters said it was essential for a person to follow politics to be a good citizen. There also were differences on the importance of jury duty; 86% of consistent voters said people must fulfill jury service if called as did a smaller majority (74%) of drop-off voters.
Nonvoters were much less likely to say that voting (40%) is essential to be considered a good citizen. Compared to voters, fewer also said that paying attention to politics (47%) and serving jury duty if called (57%) were essential to citizenship. Their views were not much different than those of voters on whether donating money (41%), participating in a religious community (27%) and volunteering are important elements of citizenship (53%).
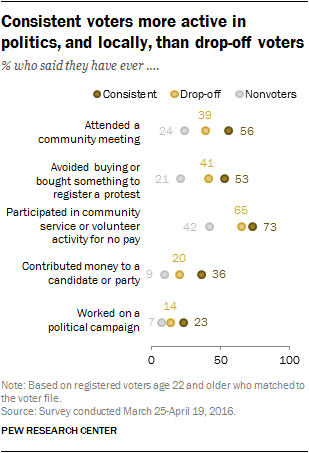
In addition to seeing citizenship differently than consistent voters when it comes to politics, drop-off voters were also less likely to report personally engaging in some forms of political activity. For example, fewer drop-off voters (20%) reported contributing money than consistent voters (36%).
Similarly, 41% of drop-off voters said they have ever “avoided buying something or purposefully bought something in order to register a protest or send a message,” while about half of consistent voters said the same (53%). Consistent voters were also more likely to say they have worked on a political campaign (23%) than drop-off voters (14%).
Still, two-thirds of drop-off voters (65%) said they had volunteered for community service (73% of consistent voters said they had done this). But fewer than half of drop-off voters (39%) said they had attended a community meeting. Among consistent voters, 56% reported doing this.
On every measure, registered nonvoters were less likely to report engaging in any form of political activity than both consistent and drop-off voters. At their most engaged, about 4-in-10 said they had volunteered for community service (42%). Just 9% said they had contributed money and 7% reported they had worked on a political campaign.
Drop-off voters less focused on politics in their social and family lives
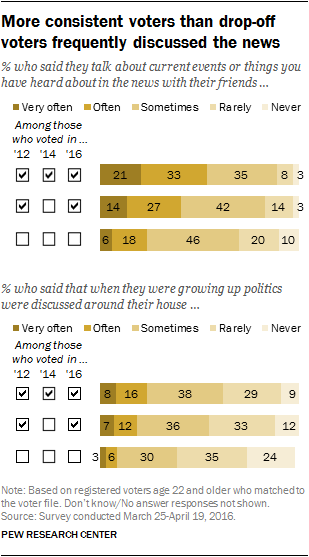
Among 2016 voters, those who missed the 2014 midterm election reported having fewer conversations with their friends about current events compared with consistent voters.
More than half (54%) of consistent voters said they talk about current events or things they have heard about in the news with their friends often or very often; 41% of drop-off voters said the same.
Similar shares of consistent voters (24%) and drop-off voters (19%) say they heard politics discussed around their houses very often or often while growing up. A much larger share of nonvoters said they heard politics discussed rarely or never (59%) than either consistent (38%) or drop-off (45%) voters.
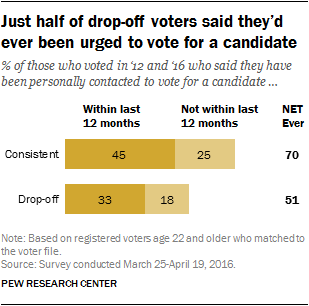
Drop-off voters reported less outreach from political candidates and campaigns than did consistent voters. Only about half of drop-off voters (51%) said they had ever been personally contacted to vote for a candidate, compared with 70% of consistent voters.
Some of this gap may be a result of voters in more competitive states and districts in 2014 being more likely to be contacted and to turn out to vote. Nevertheless, consistent voters were more likely to report being contacted even during the 12 months prior to this survey (45% vs. 33%).
Knowledge about government and politics
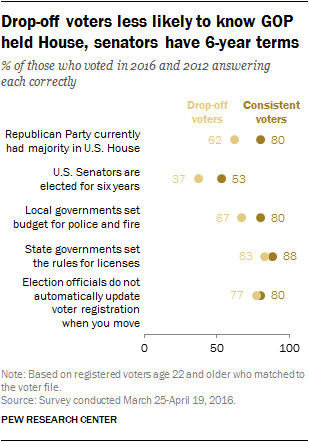
Drop-off voters were about as likely as consistent voters to know some basic facts about government and voting registration: 83% knew that state governments (not local governments or the federal government) set rules for driver and occupational licenses and 77% knew that election officials do not automatically update a person’s voter registration when they move.
Comparable shares of consistent voters answered these questions correctly: 88% knew that state governments set rules for licenses and 80% knew that voter registration is not automatically updated by election officials.
But there were wide gaps in knowledge about Congress. While 80% of consistent voters knew that Republicans had a majority in the House, fewer drop-off voters (62%) knew this. Both groups of voters struggled with a question on the length of terms for senators, but drop-off voters were less likely than consistent voters to know that senators are elected for six years (37% vs. 53%).
In addition, fewer drop-off voters (67%) than consistent voters (80%) knew that local governments set budgets for police and fire departments.
nonvoters were generally less knowledgeable about politics than consistent and drop-off voters. About half (47%) knew Republicans had the majority in the U.S. House and just 24% correctly identified the length of a U.S. Senator’s term. nonvoters were almost as knowledgeable as drop-off voters and consistent voters about day-to-day government issues regarding drivers’ and occupational licenses (77%).
Demographic differences between drop-off, consistent voters
Voters who participated in the 2016 and 2012 presidential elections who also voted in the 2014 midterm – consistent voters – were older on average than voters who cast ballots in the two presidential contests but skipped the 2014 midterm. (This analysis is based on those 22 and older, who were old enough to vote in 2012).
A sizable majority (65%) of consistent voters were 50 and older – and 29% were 65 and older. Among less consistent voters, 45% were 50 and older, with only 14% 65 and older. This is consistent with post-election analyses of the 2014 midterm, including a study by the U.S. Census, which found that voters 65 and older made up a much greater share of the electorate that year than in previous elections.
Midterm voters were also more likely to be white than those who skipped the midterm in 2014. Eight-in-ten voters who participated in the 2016 and 2012 presidential elections and the 2014 midterm were white, compared with 62% of presidential election voters who did not vote in the midterm.
Drop-off voters, however, were only slightly less educated than those who participated in the 2014 midterm (36% had no more than a high school diploma compared with 32% of consistent voters). However, a much larger share (48%) of those who did not vote in any of the three elections had no more than a high school education.
By contrast, Democrats and Democratic leaners made up much greater shares of drop-off voters (58%) and nonvoters (58%) than consistent voters (47%).
Consistent voters also were conservative, on balance. Conservative Republicans (38%) made up a larger share of consistent voters than did either liberal Democrats or conservative and moderate Democrats (24% each) or moderate and liberal Republicans (14%).
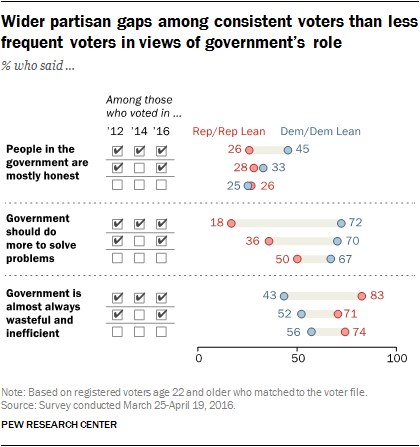
The conservative tilt among Republicans who voted in the past three elections is reflected in some of their attitudes about government. Just 18% of Republicans who voted in 2012, 2014 and 2016 said that government should do more to solve problems. Among Republican drop-off voters, just 36% said this; and among Republicans who didn’t vote in 2012, 2014 or 2016, half (50%) favored more activist government.
Democrats, regardless of their voting frequency, generally agreed that government should do more to solve problems. However, Democrats who did not vote in 2014 (but voted in 2012 and 2016) were more likely than those who voted in all three elections to express skepticism about government workers: Just 33% of drop-off Democratic voters said people in the government were mostly honest, compared with 45% of consistent Democratic voters.
Consistent voters more likely to ‘live comfortably’
Previous Pew Research analyses, such as this report in 2014, have found wide differences in financial stress between likely voters and nonvoters (those who said they were not registered or indicated they were not likely to vote).
These differences also are evident when looking at consistent and less frequent voters, based on their voting records.
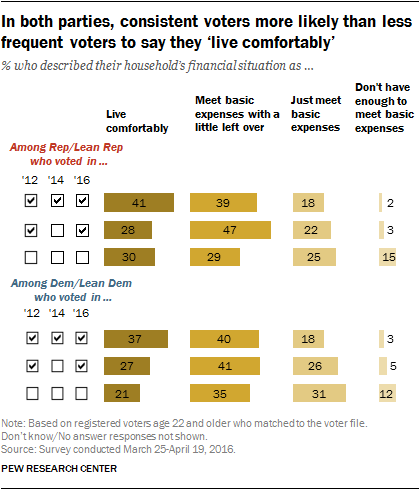
Consistent voters were more likely to describe their financial situation favorably than those who skipped the 2014 election or did not vote in any of the past three elections, and these differences hold within parties.
When asked about the household’s financial situation, 41% of Republicans who voted in all three elections said they “live comfortably.” Among Republican drop-off voters 28% said they live comfortably, as did 30% of nonvoters. Among Democrats, the pattern is even starker: 37% of consistent voters said they live comfortably, compared with 27% of less frequent voters and just 21% of nonvoters.
In both parties, nonvoters (those who were registered but did not vote in any of the past three elections), reported significant financial stress. Four-in-10 of Republican nonvoters (40%) said they either didn’t have enough to meet basic expenses or just met basic expenses. A similar share of Democratic nonvoters (44%) said they could not meet basic expenses or barely got by.


