Survey conducted Aug. 15-21, 2017
The analysis in this report is based on telephone interviews conducted Aug. 15-21, 2017 among a national sample of 1,893 adults. The interviews were conducted among adults 18 years of age or older previously interviewed in one of two Pew Research Center surveys conducted June 8-18, 2017, of 2,504 adults and June 27-July 9, 2017, of 2,505 adults (for more on the methodologies of the original surveys, see here and here). The survey was conducted by interviewers at Princeton Data Source under the direction of Princeton Survey Research Associates International. Interviews were conducted on both landline telephones and cell phones (517 respondents for this survey were interviewed on a landline telephone, and 1,376 were interviewed on a cell phone). Interviews were conducted in English and Spanish. Interviewers asked to speak with the respondent from the previous interview by first name, if it was available, or by age and gender. For detailed information about our survey methodology, see https://www.pewresearch.org/methodology/u-s-survey-research/
Weighting was performed in two stages. The weight from the original sample datasets was used as a first-stage weight for this project. This first-stage weight corrects for different probabilities of selection and differential non-response associated with the original interview. The sample of all adults contacted for this survey was then raked to match parameters for sex by age, sex by education, age by education, region, race/ethnicity, population density, phone use. The non-Hispanic, white subgroup was also raked to age, education and region. These parameters came from the 2015 Census Bureau’s American Community Survey and population density to parameters from the Decennial Census. The sample also is weighted to match current patterns of telephone status (landline only, cell phone only, or both landline and cell phone), based on extrapolations from the 2016 National Health Interview Survey. Sampling errors and statistical tests of significance take into account the effect of weighting.
The following table shows the unweighted sample sizes and the error attributable to sampling that would be expected at the 95% level of confidence for different groups in the survey:
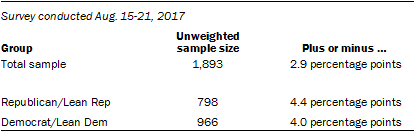
Sample sizes and sampling errors for other subgroups are available upon request.
In addition to sampling error, one should bear in mind that question wording and practical difficulties in conducting surveys can introduce error or bias into the findings of opinion polls.
Pew Research Center undertakes all polling activity, including calls to mobile telephone numbers, in compliance with the Telephone Consumer Protection Act and other applicable laws.
Pew Research Center is a nonprofit, tax-exempt 501(c)(3) organization and a subsidiary of The Pew Charitable Trusts, its primary funder.
Survey conducted Aug. 8-21, 2017
The American Trends Panel (ATP), created by the Pew Research Center, is a nationally representative panel of randomly selected U.S. adults recruited from landline and cell phone random digit dial surveys. Panelists participate via monthly self-administered Web surveys. Panelists who do not have internet access are provided with a tablet and wireless internet connection. The panel is being managed by Abt Associates.
Data in this report are drawn from the panel wave conducted Aug. 8-21, 2017 among 4,971 respondents. The margin of sampling error for the full sample of 4,971 respondents is plus or minus 2.3 percentage points.
Members of the American Trends Panel were recruited from several large, national landline and cellphone random digit dial (RDD) surveys conducted in English and Spanish. At the end of each survey, respondents were invited to join the panel. The first group of panelists was recruited from the 2014 Political Polarization and Typology Survey, conducted Jan. 23 to March 16, 2014. Of the 10,013 adults interviewed, 9,809 were invited to take part in the panel and a total of 5,338 agreed to participate. 1 The second group of panelists was recruited from the 2015 Pew Research Center Survey on Government, conducted Aug. 27 to Oct. 4, 2015. Of the 6,004 adults interviewed, all were invited to join the panel, and 2,976 agreed to participate. 2 The third group of panelists was recruited from a survey conducted April 25 to June 4, 2017. Of the 5,012 adults interviewed in the survey or pretest, 3,905 were invited to take part in the panel and a total of 1,628 agreed to participate. 3
The ATP data were weighted in a multi-step process that begins with a base weight incorporating the respondents’ original survey selection probability and the fact that in 2014 some panelists were subsampled for invitation to the panel. Next, an adjustment was made for the fact that the propensity to join the panel and remain an active panelist varied across different groups in the sample. The final step in the weighting uses an iterative technique that aligns the sample to population benchmarks on a number of dimensions. Gender, age, education, race, Hispanic origin and region parameters come from the U.S. Census Bureau’s 2015 American Community Survey. The county-level population density parameter (deciles) comes from the 2010 U.S. Decennial Census. The telephone service benchmark comes from the January-June 2016 National Health Interview Survey and is projected to 2017. The volunteerism benchmark comes from the 2015 Current Population Survey Volunteer Supplement. The party affiliation benchmark is the average of the three most recent Pew Research Center general public telephone surveys. The Internet access benchmark comes from the 2017 ATP Panel Refresh Survey. Respondents who did not previously have internet access are treated as not having internet access for weighting purposes. Sampling errors and statistical tests of significance take into account the effect of weighting. Interviews are conducted in both English and Spanish, but the Hispanic sample in the American Trends Panel is predominantly native born and English speaking.
The following table shows the unweighted sample sizes and the error attributable to sampling that would be expected at the 95% level of confidence for different groups in the survey:
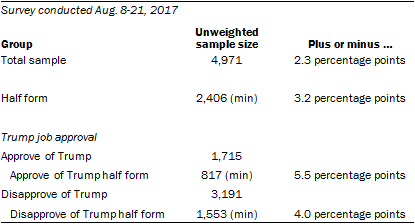
Sample sizes and sampling errors for other subgroups are available upon request.
In addition to sampling error, one should bear in mind that question wording and practical difficulties in conducting surveys can introduce error or bias into the findings of opinion polls.
The August 2017 wave had a response rate of 74% (4,971 responses among 6,722 individuals in the panel). Taking account of the combined, weighted response rate for the recruitment surveys (10.0%) and attrition from panel members who were removed at their request or for inactivity, the cumulative response rate for the wave is 2.6%. 4
