Politicians are increasingly turning to social media to engage directly with their constituents and other members of the public. Unlike press releases, where audience feedback is indirect and difficult to measure, Facebook enables people to react directly to what members of Congress say in the form of likes, comments and shares, providing an easily accessible and direct measurement of engagement with members’ content.
On Facebook – the social media platform with the largest user base among online U.S. adults – the audience for posts includes people who follow a legislator’s Facebook page, and depending on other factors such as whether the post is promoted, may include followers’ friends and others. What’s more, a lawmaker’s official Facebook page and posts are publicly available.
Followers and other users may see posts from members in their News Feed, which relies on a ranking system that gives prominence to content that receives more likes, comments and shares. Thus, posts that generate more engagement are likely to be seen by more people.
Disagreement, indignation saw greater engagement on Facebook
Posts that contained political disagreement and indignant rhetoric were far more likely to elicit user engagement than posts that did not. On average, posts expressing disagreement with the opposing party received one and a half times as many likes as posts without disagreement (406 likes, compared with 262), and almost three times as many comments (68 vs. 24). This pattern holds for the number of shares, which was twice as high for posts with disagreement (91 shares vs. 45).
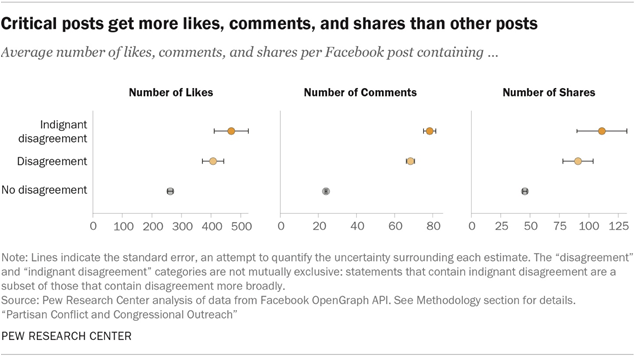
When disagreement crossed the line to indignation, posts received an even higher boost, with almost two times as many likes (468 vs. 262), about three times as many comments (78 vs. 24) and more than twice as many shares, (111 vs. 45) on average.
There was far less engagement with posts focused on bipartisan activity. Those posts averaged just 166 likes, 28 comments and 30 shares.
The most liberal and conservative members received more likes, comments and shares than moderates’ posts did. Very conservative Republicans – those in the top 10% of the DW-NOMINATE measure – averaged 1,164 likes, 123 comments, and 187 shares while moderate Republicans earned 78 likes, 14 comments, and 12 shares. Among Democrats, the most liberal elected officials earned 1,266 likes, 63 comments, and 285 shares, while moderates earned 140 likes, 22 comments and 18 shares, on average.
Statistical models can help answer the question of whether negativity is associated with engagement overall, or whether members who are more likely to express negativity happen to have large groups of highly engaged followers for other reasons. These models provide evidence for a direct association between negativity and engagement.
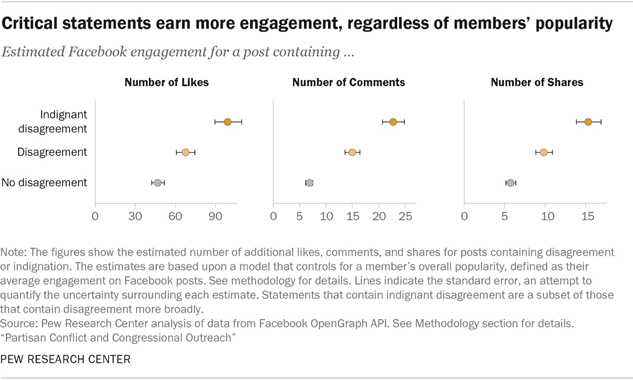
The relationship between disagreement expressed in posts and engagement with each post persisted when employing statistical models that account for average engagement with each member’s posts, suggesting that the additional likes, comments and shares associated with disagreement are not merely artifacts of particularly popular legislators posting critical content.17
An important caveat is that this analysis did not control for the total number of people who actually saw the post, as Facebook does not make these data publicly available. It is possible, for example, that posts with more controversial content prompted more comments than other posts, which in turn increased their score in the News Feed ranking system, increasing the number of people who saw these posts. There may have been other differences, for example due to the timing of when posts were issued or when audiences were online.
