Survey report
In the contentious weeks leading up to Election Day, voters are deeply divided over the candidates, major issues and the nation’s past and future course. And, in a new survey, most voters say these differences even extend to disputes over basic facts.
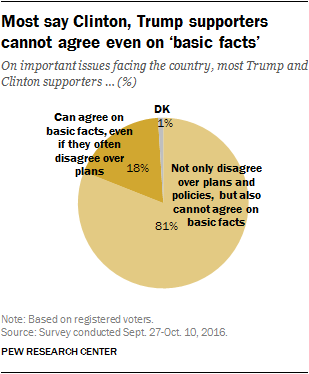
Fully 81% say that most supporters of Hillary Clinton and Donald Trump not only disagree over plans and policies, but also disagree on “basic facts.” Just 18% say that while Clinton and Trump supporters often differ over plans and policies, they can agree on basic facts.
Ironically, this is a rare point of agreement among the supporters of Clinton and Trump. Comparably large shares of registered voters who back Clinton (80%) and Trump (81%) say the two sides are unable to agree on basic facts.
The survey was conducted online from September 27 to October 10 among 4,132 adults, including 3,616 registered voters, on Pew Research Center’s nationally representative American Trends Panel. It was largely completed before the release of a videotape from 2005 showing Trump making lewd comments about women.
The survey finds new indications of how negative attitudes toward the opposition have become a defining feature of the current campaign. It includes a test of “feeling thermometer” ratings of the candidates. Notably, both Republicans and Democrats feel significantly less “warmly” about their own candidate than “coldly” toward the opposing candidate.
About two-thirds of Democratic and Democratic-leaning voters (68%) give Clinton “warm” ratings on a 0-100 thermometer and 66% of Republicans give a warm rating to Trump. But 85% of Democrats give Trump a cold rating, and 88% of Republicans give Clinton a cold rating.
With the election now less than a month away, the survey also finds:
Most voters continue to expect a Clinton victory. About six-in-ten voters (63%) say they think Clinton will win on Nov. 8, while just 34% expect a Trump victory. This is little changed from surveys conducted since July. However, most think the outcome will be close, regardless of who they think will win.
Most also say it is important for the losing candidate to publicly concede. A sizable majority (77%) thinks it is very important (53%) or somewhat important (24%) that the losing candidate on Nov. 8 “publicly acknowledges the winner as the legitimate president.” Just 22% say this is not too or not at all important.
Six-in-ten voters who favor Clinton (60%) say it is very important for the losing candidate to concede, as do 51% of Trump supporters.
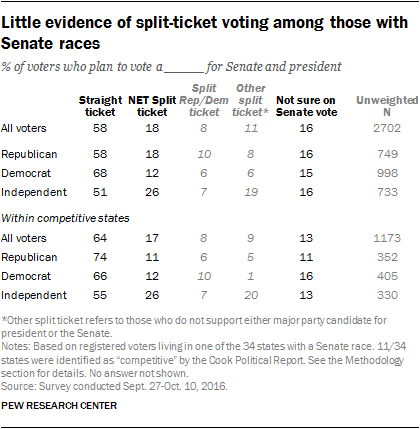
Split-ticket voting is still rare. As in the recent past, split-ticket voting is relatively rare, and most who expect to do so this year are splitting their ballots between third-party candidates for president and either Republicans or Democrats for the Senate and House. Overall, just 8% of voters in the 34 states with Senate races say they will vote for either Clinton or Trump for president and a Senate candidate from the opposing party. Even fewer (4%) expect to vote for a Democrat or Republican for president and a House candidate from the other party.
Rating the candidates on a ‘feeling thermometer’
As part of a major study of political animosity, released in June, respondents were asked to rate several leading political figures, including Hillary Clinton and Donald Trump, on a 0-100 “thermometer” – where 0 is the coldest, most negative rating and 100 represents the warmest, most positive rating.
Views of Clinton and Trump have changed only modestly since then. Among all voters, Clinton’s mean, or average, rating is 40, while Trump’s is 37. Far more voters give both candidates “cold” than “warm” ratings on the 0-100 scale.
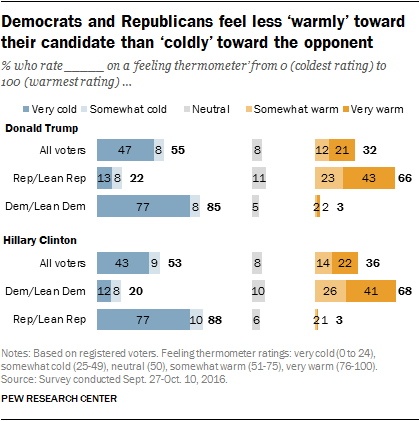
These ratings remain deeply polarized along partisan lines. Democrats and Democratic-leaning independent voters give the Republican nominee a mean rating of just 10 on the feeling thermometer. Fully 85% give Trump a cold rating, with 77% rating him very coldly (0-24 on the 100-point scale). In fact, most Democrats (58%) give Trump a rating of zero.
Likewise, Republican and Republican-leaning voters give Clinton an average rating of 11 on the 0-100 scale. A wide majority give her a very cold (77%) or somewhat cold (10%) rating, including 56% who give her a rating of zero.
Across both parties, a majority of voters express warm feelings toward their own party’s nominee, but fewer rate their party’s candidate warmly than rate their opponent coldly. Two-thirds of Republicans (66%) give Trump a very or somewhat warm rating, and a comparable share of Democrats (68%) express warmth toward Clinton.
While voters who supported Donald Trump or Hillary Clinton in the primaries have not changed in their ratings of the candidates since spring, supporters of other primary candidates across both parties have grown somewhat warmer in their attitudes toward their party’s presidential nominee.
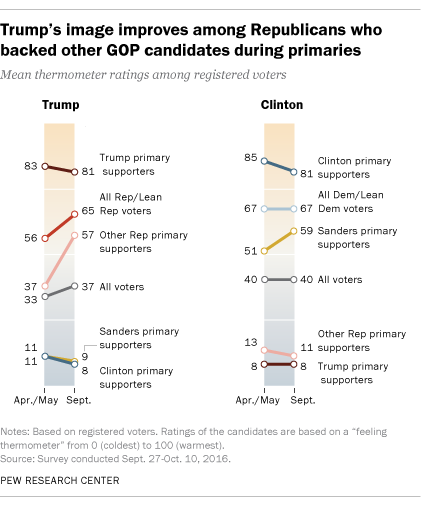
Currently, Republican and Republican-leaning voters give Donald Trump a mean rating of 65 on the 0-100 scale, up from 56 in May.
The change since then has come entirely among GOP voters who supported primary candidates other than Trump. Trump’s mean thermometer rating among Republican voters who backed a candidate other than Trump for the Republican nomination is 57; in May, it was only 37.
Still, Republican voters who supported Trump in the primary give far warmer ratings of the candidate; the mean rating among Trump primary supporters in May was 83, and today it is 81.
Among Democrats, supporters of Bernie Sanders in the primary gave Clinton a mean rating of 51 in May; Sanders primary supporters now give her an average rating of 59. Despite the warmer attitudes among Sanders supporters over the course of the campaign, Clinton’s primary supporters continue to rate her far higher on the “thermometer” (85 then, 81 now).
Demographic differences in thermometer ratings
Feelings toward the candidates also vary across demographic groups, though there are few groups of voters that give either candidate a “warm” mean rating of 51 or higher.
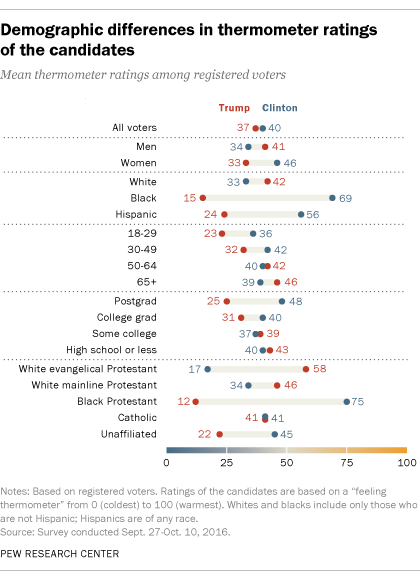
Voters overall give an average rating of 37 of Trump, and 40 of Clinton. The average rating of Clinton among women is higher than their average rating of Trump (46 vs. 33), while men give Trump a higher mean rating (41) than they do Clinton (34).
Most black voters feel very warmly toward Clinton – her mean rating among blacks is 69 – while registering very cold ratings for Trump (mean rating of 15). By contrast, whites, on average, feel more warmly toward Trump (42 mean rating) than Clinton (33).
Hispanics’ average thermometer ratings are much higher for Clinton (mean rating of 56) than Trump (24). (For more on Hispanics’ attitudes about the candidates, see “Latino Voters and the 2016 Election.”)
Notably, most white evangelical Protestant voters feel warmly toward Trump; his mean rating among white evangelicals is 58, while Clinton’s is just 17. By contrast, Clinton’s mean rating is much higher than Trump’s among religiously unaffiliated voters (45 vs. 22).
While there are only modest differences by age in ratings of Clinton, ratings of Trump vary significantly by age. Voters under 30 give Trump a rating of 23, on average, which is much lower on the scale than the average rating among voters ages 65 and older (46).
Voters with postgraduate degrees give Trump far lower ratings on average than those with less education (25 vs. 43 among those with a high school diploma or less education). Those who have postgraduate degrees are closer to neutral in feelings toward Clinton, with an average rating of 48 on the 0-100 scale.
Voters’ views of the election outcome and its aftermath
While Clinton is widely expected to win, far more who anticipate a Clinton victory think it will be a close election (44% of all voters say this) than say she will win by “a lot” (19% say this). Similarly, while 34% predict a Trump victory, most who do so (25% of all voters) expect it will be by close margin.
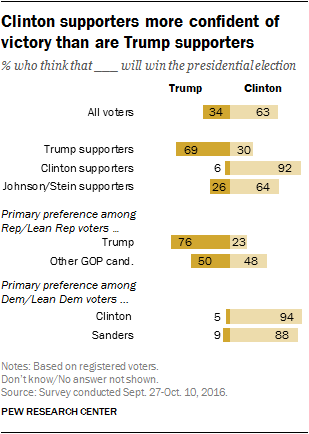
Overall, Clinton supporters are much more confident of victory than are Trump supporters. Fully 92% of registered voters who support Clinton for president expect her to win; 69% of Trump supporters expect him to win.
Among voters who support Libertarian Party nominee Gary Johnson or Green Party nominee Jill Stein, 64% expect Clinton to win.
GOP voters who did not support Trump in the Republican primaries are particularly skeptical about his general election prospects. Only half (50%) of Republican and Republican-leaning registered voters who did not support Trump in the primaries say he will win, while about the same percentage (48%) expect Clinton to win. About three-quarters of GOP voters who backed Trump in the primaries (76%) anticipate a Trump victory on Nov. 8.
Among Democrats, overwhelming shares of those who supported Bernie Sanders in the primaries (88%) and Clinton primary supporters (94%) expect Clinton to win next month.
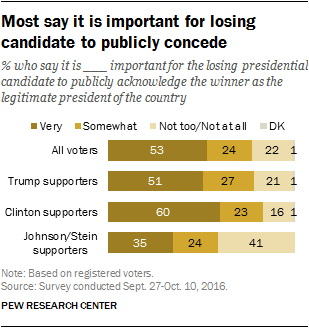
When the election is concluded, most voters say it is either very important (53%) or somewhat important (24%) for the losing candidate to acknowledge the winner as “the legitimate president of the country.” Only about one in five (22%) say a public concession by the losing candidate is “not too” or “not at all important.”
Clinton supporters (60%) are more likely than Trump supporters (51%) to view a concession as very important. Only about one in five of each candidate’s supporters (21% of Trump backers, 16% of Clinton backers) say this is not important. By contrast, roughly twice as many Johnson and Stein supporters (41%) think it is not too or not at all important that the losing candidate publicly acknowledge the winner as the legitimate president.
Few intend to split ballots between Democrats and Republicans
When asked who they are supporting in the November election, 65% of voters say they will be supporting candidates from the same party in their votes for the presidency and House of Representatives. A slightly smaller proportion of voters in states with Senate races (58%) say they will be supporting candidates from the same party in their votes for the Senate and presidency.
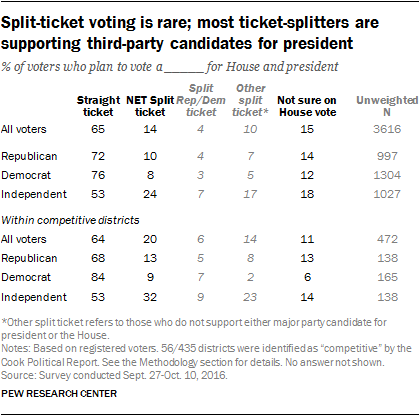
About half of these “straight-ticket” voters (30% for the House and 25% for the Senate) say they will be voting for Republicans; the remainder says they will vote for Democrats (36% in the House and 33% in the Senate).
The number of voters who say they will be supporting the Republican candidate for president and the Democratic candidate for Congress, or vice versa, is very small. Only 2% of voters say they will vote for Donald Trump for president and a Democratic candidate for the House. As many (2%), say they will support Hillary Clinton for president and a Republican candidate for the House.
Many of those who are splitting their ballots this year favor either Gary Johnson or Jill Stein for president, while supporting Democrats or Republicans for the House. Overall, 5% support Johnson or Stein and plan on voting for a Republican in their congressional race. A similar proportion of Johnson and Stein supporters (4%) say they will vote for the Democrat in their House district. Less than 1% of voters are not supporting major party candidates either for president or the House.
Another 15% have a presidential preference, but say they do not know who they are supporting in their congressional race.
In Senate races, which generally have a higher profile than House races, 8% say they are voting for a Republican or Democratic presidential candidate, and a Senate candidate from the other party. About one-in-ten (11%) split their ticket in another way, with most (10% overall) supporting Johnson or Stein for president and a major party candidate for Senate.

