Ahead of the party conventions – and four months before the general election – Hillary Clinton holds a significant edge over Donald Trump in voter preferences.

Among registered voters, 45% say they would vote for Hillary Clinton if the election were held today, compared with 36% who say they would vote for Donald Trump and 11% who say they would vote for the libertarian candidate Gary Johnson.
When asked to choose only between the two major party candidates, 51% would choose Clinton and 42% would choose Trump (an identical margin to the one when Gary Johnson is included in the question).
At this point in the campaign, many Clinton and Trump supporters describe their choice as a vote against the opposing candidate. In addition, for the first time since the 2000 election, fewer than half of both candidates’ supporters say they back their candidate strongly. Nonetheless, in an increasingly polarized environment, very few supporters of either candidate say there is a chance they might change their mind and vote for the other candidate this fall.

Among those who choose Trump over Clinton in the head-to-head question on voter preferences, 55% say their choice is more a vote against Clinton than for Trump. A smaller share (41%) says their vote is more for Trump than against Clinton. In 2008 and 2000 (the two most recent presidential elections with no incumbent candidate), no more than about a third of those planning to support the Republican candidate said their choice was more a vote against the Democrat than for the Republican.
“Negative voting” is also widespread on the Democratic side. Among those planning to support Clinton in the general election, half (50%) say they think of their choice as more of a vote against Trump than for Clinton. About as many (48%) say their vote is more for Clinton than against Trump. The share of Democratic general election supporters who say they think of their vote more as a vote against the Republican candidate is higher than it was at this point in each of the past four presidential elections.
In addition, fewer than half of both Clinton and Trump supporters say they support their candidate “strongly.”

Among registered voters who prefer Trump in the head-to-head vote choice question, 45% say they support him strongly. Among those who prefer Clinton, strong support is the same (45%).
Somewhat fewer Republican supporters backed the GOP candidate strongly in the summer of 2012 (38%) and 2008 (34%), when Mitt Romney and John McCain were the Republican presidential nominees. However, strong support on the GOP side is far lower than it was during George W. Bush’s 2004 reelection campaign (71%). Strong support for Trump among his backers is about the same as it was among Bush’s supporters during the summer of his first presidential campaign in 2000 (46%).
Strong support among Democratic candidate supporters is much lower among Hillary Clinton backers today (45%) than it was among Obama backers in 2012 (60%) and 2008 (58%) as well as Kerry voters in the summer of 2004 (59%). The current level of strong support among those who prefer Clinton in the general election is comparable to that of Gore backers in the summer of 2000 (40%).
Among Clinton supporters, blacks (59%) express some of the highest levels of strong support for her. Among Trump supporters, those with no more than a high school diploma are especially likely to say they back Trump strongly (56%).
While supporters of both Trump and Clinton express relatively low levels of strong support for their candidate, very few say they are considering voting for the other candidate.

Overall, just 8% of those who prefer Trump in the general election say there is a chance they might vote for Clinton in November, far more (91%) say they have definitely decided not to vote for her.
Similarly, only 6% of those who support Clinton say there is a chance they might vote for Trump in the fall, compared with 93% who say they definitely will not.
At this point in the campaign, the share of Republican candidate-supporters who say they will not consider voting for the Democrat is much higher than it was at similar points in 2008 (72%) and 2000 (72%), the last two general elections without an incumbent candidate.
On the Democratic side, the 93% of Clinton supporters who say they definitely will not vote for Trump is significantly higher than the share of Democratic candidate-supporters who said this in each of the past four presidential elections. For example, in the summer of 2000, 69% of those who supported Al Gore said there was no chance they would vote for George W. Bush in the fall, compared with 26% who said there was a chance they might.
Familiar patterns of support across demographic groups
At this point in the campaign, there are familiar divides in preferences across demographic groups, with Trump and Clinton each drawing support from groups that have favored their respective parties in recent presidential elections.
Hillary Clinton holds a wide 60%-30% advantage over Trump among young voters (ages 18-29). Among women, Clinton leads Trump 59% to 35%. Blacks (91%-7%) overwhelmingly support Clinton over Trump.
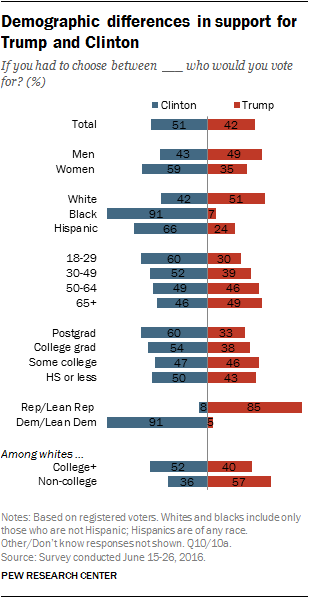
Trump fares relatively better among men, older voters and white voters. Trump leads Clinton 51% to 42% among whites. Among men, 49% back Trump, compared with 43% who support Clinton. Voters ages 50 and older are roughly divided in their support, but Trump performs more strongly among this group than among younger voters.
Ahead of the conventions, Clinton receives slightly more support from Democratic and Democratic leaning voters (91%) than Trump gets from Republican and Republican leaning voters (85%).
Among white voters, there is a clear divide in support by level of educational attainment. White voters with a college degree support Clinton over Trump by a 52%-40% margin. Views are the reverse among white voters without a college degree: 57% support Trump, compared with 36% who support Clinton.
For the most part, differences in voter preferences across demographic groups are comparable to those seen at this point in the 2012 and 2008 presidential campaigns.
Hillary Clinton’s 24-point edge over Trump among women is somewhat higher than the 15-point advantage Obama held over Mitt Romney in June 2012 and the 14-point advantage Obama held over John McCain in the summer of 2008.
Clinton is also running significantly better among those with college degree at this stage of the campaign than Obama was in 2012 and 2008.

Republican and Democratic voters who did not support their party’s presumptive nominee in the primaries are somewhat less likely than those who did to say they plan to support their party’s candidate in the general election.

Among Republican and Republican-leaning registered voters who preferred a candidate other than Trump in the primaries, 77% say they plan to support him in the general election, while 14% say they will vote for Clinton and 9% volunteer another candidate’s name or say they aren’t sure who they will support.
Support for Clinton is slightly higher among Democrats and Democratic leaners who backed Sanders in the primary contests: 85% say they plan to vote for Clinton in the general election, compared with 9% who say they will vote for Trump and 6% who volunteer that they will voter for another candidate or don’t know.
Primary differences persisting into the summer of an election year are nothing new. In June 2008, after a closely contested Democratic primary between Hillary Clinton and Barack Obama, 69% of Democrats who preferred Clinton said they would vote for Obama in the general election, while 16% said they would support John McCain and 12% volunteered that they would support another candidate or did not know who they would vote for.
Hillary Clinton holds an identical nine-point edge over Trump in a head-to-head general election question (51%-42%) as well as in a general election question that names libertarian candidate Gary Johnson (45%-36%; 11% support Johnson). Patterns of support for Trump and Clinton across demographic groups are similar in both versions of the general election preference question. Johnson’s strongest performance is among younger voters: 22% of 18-29 year olds say they would vote for him when his name is offered. By comparison, just 6% of voters 50 and older would back Johnson.


