Survey Report
When it comes to choosing a party’s candidate in the voting booth, one pattern in modern American politics is so familiar it has become a truism: the rich vote Republican, the poor vote Democratic. And while the reality of the situation is much more nuanced, in broad strokes it has been the case that Republicans have consistently garnered disproportionate levels of support from the financially well-off, while the least financially secure Americans have been significantly more likely to back Democrats.
But a new analysis of Pew Research Center survey data collected in the fall lead-up to the 2014 midterm elections finds that at least as striking is the degree to which those who are financially insecure opt out of the political system altogether, and how that opting out disproportionately affects Democratic support.
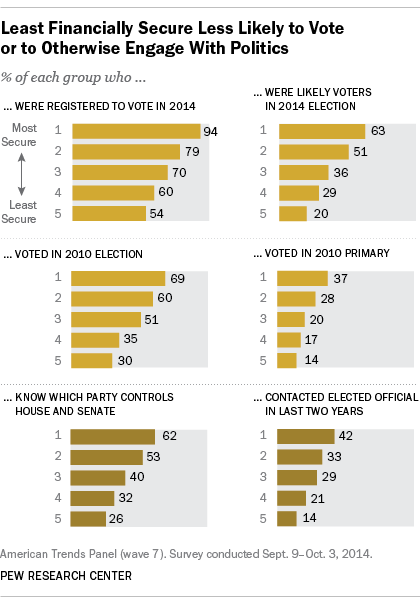
Financial security is strongly correlated with nearly every measure of political engagement. For example, in 2014, almost all of the most financially secure Americans (94%) said they were registered to vote, while only about half (54%) of the least financially secure were registered. And although 2014 voting records are not yet available, pre-election estimates suggest that 63% of the most financially secure were “likely voters” last year, compared with just 20% of the least financially secure.
This pattern is not unique to 2014. Looking back at voting records from four years earlier, 69% of the most financially secure cast ballots in the 2010 midterm, while just 30% of the least financially secure did so1.
How We Define “Financial Security”
Throughout this report, we divide the public into five groups based on their overall level of financial security, a measure that correlates with income but provides a more nuanced understanding of the extent to which Americans at different income levels are on solid footing in the modern economy. To do this, we created a scale of financial security, based on 10 interrelated items. Using the scale, we then divided the public into five groups that vary between 15% and 25% of the public.
Four of the items on the scale are measures of financial security (having a savings account, a checking account, a credit card or any form of retirement savings), while six of the items on the scale are measures of financial insecurity, including two items measuring the receipt of means-tested benefits (SNAP benefits, Medicaid), as well as four measures of financial stress (having trouble paying bills, affording housing or medical care or borrowing money from family or friends).
Overall, 25% of the public are in the most financially secure group (having all four of the characteristics of financial security and none of the indicators of financial insecurity); 20% of the public are in the least financially secure group. See Appendix A for full details of the scale and the groups.
Financially insecure Americans are also far less likely than those at the top of the security scale to be politically engaged in other ways. For example, just 14% say they have contacted an elected official in the last two years; by comparison 42% of the most secure have done this. And when it comes to overall awareness of the political landscape, about six-in-ten (61%) of the most financially secure Americans could correctly identify the parties in control of both the House and Senate, compared with just 26% of the least financially secure. (To put this in context, because these are two two-option multiple-choice questions, this latter figure is no greater a percentage than would have identified this by chance.)
This report is based on Pew Research Center data collected as a part of the center’s American Trends Panel, a nationally representative panel of randomly selected U.S. adults surveyed online and by mail. Most of this analysis is drawn from a survey conducted Sept. 9-Oct. 3 with 3,154 panelists. Rather than relying on family income – a useful but blunt measure – as a surrogate for a person’s financial situation, this survey included detailed questions about economic security and insecurity, including measures of financial hardship (such as having difficulty paying bills and receiving means-tested government benefits), as well as financial assets and tools (such as having credit cards, bank accounts and retirement savings). These measures were combined to create an index of financial security that is used throughout this report; it segments the American public into five roughly equal sized groups (see below and Appendix A for more details on the measures).
Respondents in the poll also were asked several questions about their likelihood of voting in the 2014 general election. These questions were used to create a likely voter scale, which was used to divide respondents into likely voters and non-voters. Details about this scale can be found in Appendix C.
Political Values and Partisan Choices
Political struggles between the haves and the have-nots have animated U.S. politics throughout its history. Indeed, in arguing that the proposed U.S. Constitution provided the best means of managing political conflict among factions, James Madison observed in 1787 that “the most common and durable source of factions has been the various and unequal distribution of property.” Political conflict based on economic circumstances underlies not only the division between Republicans and Democrats but splits within both parties as well.
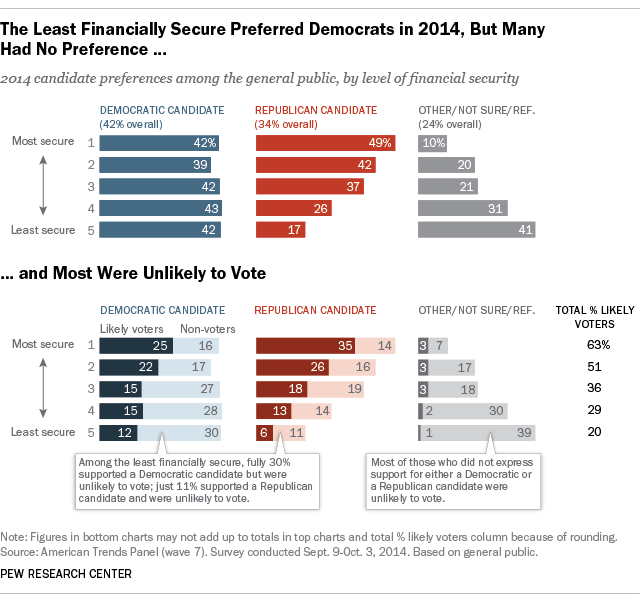
During the fall campaign season, we asked panelists – voters and non-voters alike – which candidate they preferred for Congress. Support for Republican candidates was strongly associated with financial security: among the most secure group, 49% favored or leaned to the Republican candidate, compared with just 17% among the least secure group.
But support for Democratic candidates did not correspondingly increase with financial insecurity: 42% of the most secure group preferred or leaned to the Democrat, the same as among the least secure group. Instead, at higher levels of financial insecurity, greater percentages indicated that they had no preference or preferred another candidate.
Roughly a third (34%) of the least financially secure expressed no preference in the midterm, while 6% said they supported a candidate other than a Republican or a Democrat. Combined, that is the highest percentage of any group based on the scale of financial security. Among the most financially secure, just 6% had no preference while 4% favored another (non-Democratic or Republican) candidate.
Across all groups, most of those who had no preference or said they supported another candidate in September were classified as unlikely voters, based on their position on the likely voter scale. Because of their greater uncertainty about candidate preference and their lower propensity to vote, the least financially secure were poorly represented at the ballot box, with just 20% of this group predicted to turn out.
As a consequence, in 2014, the Democratic Party left far more potential votes “on the table” than did the Republicans. For example, among all of those in the least financially secure category, more than twice as many favored the Democratic candidate over the Republican (42% to 17%). But just 12% of this group favored the Democrat and were likely voters; fully 30% supported Democrats but were unlikely to vote.
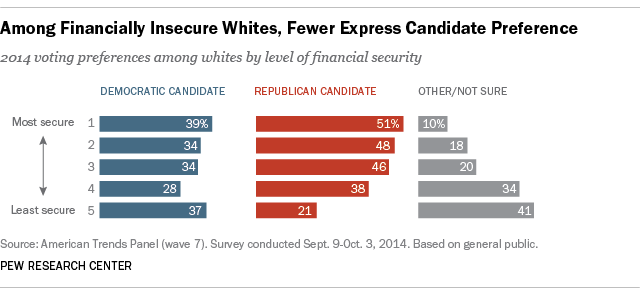
After the 2014 midterm election in which the GOP scored major gains in Congress and the statehouses, a particular theme of post-election analyses focused on the relatively low levels of support Democratic candidates received from white working class voters. It is true that Republican candidates were preferred to Democratic candidates among whites in all but the least financially secure group. But the overall relationship between financial situation, partisan choice and political engagement among the general public is evident among whites as well. Republican support declines as financial insecurity increases, while Democratic support is relatively flat. About three-in-ten (31%) of the least financially secure white adults declined to express a candidate preference in 2014, compared with just 6% among the most secure.
Financial Security and Political Values
Financial insecurity is associated with a lack of support for the Republican Party, but it does not translate into correspondingly greater levels of allegiance for the Democrats. Why is this? Part of the answer might be found in the political values of those who are financially secure and those who are not.
In our 2014 report on Political Polarization in the American Public, we used a scale based on 10 political values questions about the role of government, the environment, homosexuality and other issues to measure the direction and consistency of a person’s ideological thinking. How a person’s political values line up is strongly related to his or her partisanship, and whether political values line up in a consistent way is strongly related to whether he or she participates in politics or not. The financially secure and insecure differ in both the direction and consistency of their political values.
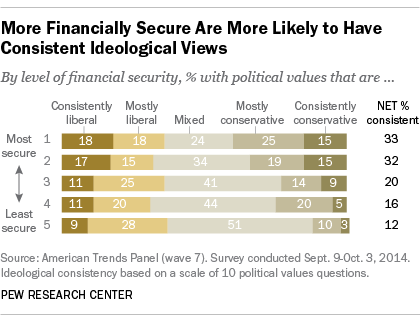
The financially secure (40% consistently or mostly conservative) hold more conservative values than the financially insecure (13% consistently or mostly conservative). But the financially secure and insecure are about equally likely to hold liberal values – 36% among the most secure, 37% among the least secure. And those with the highest level of financial insecurity are far less likely to have consistently liberal values than those who are the most financially secure (9% vs. 18%).
In general, the financially secure are more likely to have ideologically consistent views, that is, political values that are consistently liberal or consistently conservative across multiple dimensions. The financially insecure are much less likely to have consistent opinions and values: 51% hold a diverse mix of liberal and conservative values, compared with just 24% among the most secure group. People who hold an inconsistent mix of liberal and conservative values are far less likely to be interested in politics, to express a preference between the Democrats and Republicans, to hold strong opinions about the parties or to vote.
An examination of the individual values that make up the ideological consistency scale offers additional insight into the political choices of the financially secure and the insecure. The 10 items in the scale were chosen to represent major axes of political conflict and choice, and collectively can powerfully predict both political engagement and partisan choice. Compared with the most financially secure, the most financially insecure are considerably more liberal on two items dealing with the social safety net, and somewhat more liberal on three other items. They are, overall, not significantly different on four items, and somewhat more conservative on one.
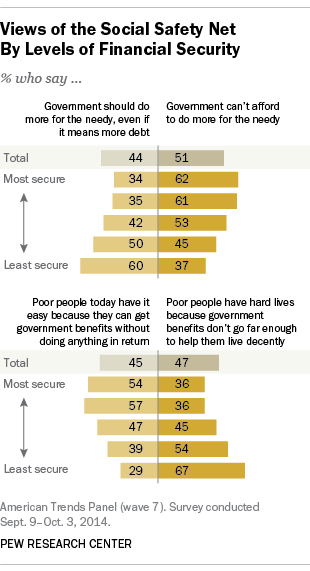
Those who face the greatest financial insecurity are the most reliant on government benefits; more than half of the least secure group reports receiving at least one type of means-tested government benefit. They also are more likely than the most financially secure to say that “the government should do more to help needy Americans, even if it means going deeper into debt.” Among the least financially secure, 60% express this view; no more than half in any other group (including just 34% of the most financially secure) say the government should do more to assist the needy if it means adding to the debt. Similarly, the least secure are far more likely than the most secure to say that “poor people have hard lives because government benefits don’t go far enough to help them live decently.”
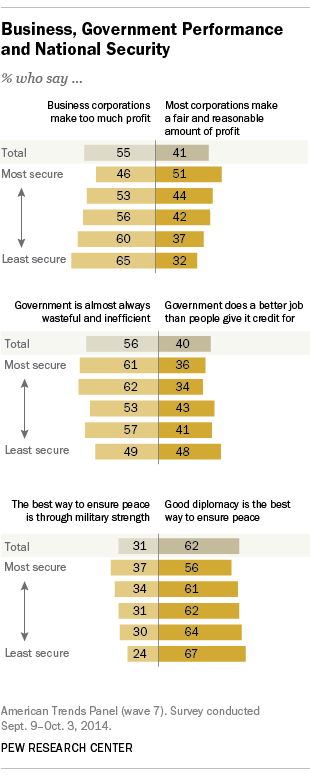
Financial security also is related to attitudes about business. The least secure group is more likely than those who are better off to say that businesses make too much profit (a 20-point difference with the most secure group).
Notably, the least financially secure have a mixed view of government performance. About half (49%) say the “government is almost always wasteful and inefficient,” while nearly as many (48%) say government “often does a better job than people give it credit for.” But among the two most financially secure groups, roughly six-in-ten fault the government for being wasteful and inefficient.
Differing majorities across all of the groups – ranging from 67% of the least financially secure to 56% of the most secure – say that “good diplomacy is the best way to ensure peace.”
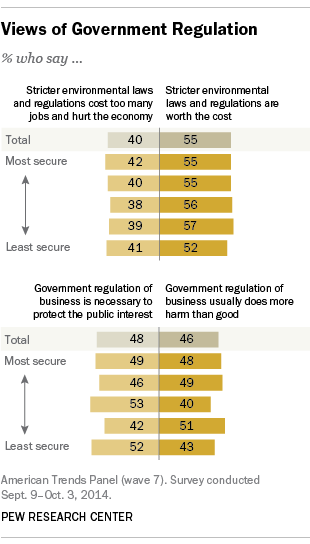
Yet on four other items there is no significant difference in values by financial status. Between 52% and 57% across all financial categories say stricter environmental laws and regulations are worth the cost. Similarly, virtually identical percentages in all groups say that government regulation of business is necessary to protect the public interest.
Views about black progress also vary little by financial situation. Between 62% and 66% of all financial groups say that blacks who can’t get ahead are mostly responsible for their own condition.
And although social issues like gay rights are sometimes mentioned as explanations for why the Democratic Party fails to capture more support from financially challenged Americans, the financially insecure are no more or less likely than other groups to say that homosexuality should be accepted by society (majorities of between 61% and 66% of all groups say it should be). And this question correlates much more strongly with the vote among the financially well-off than among those who struggling.
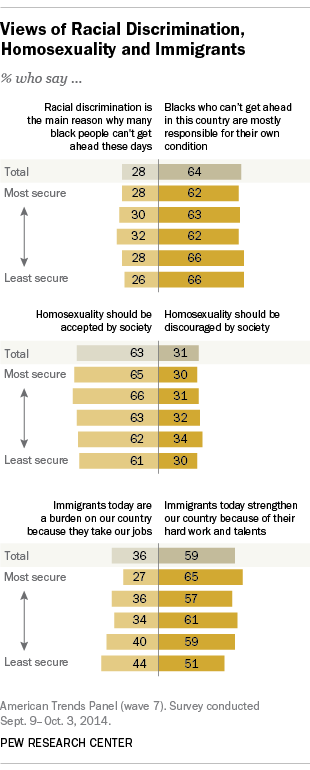
On only one item – perceptions of the economic impact of immigrants – are the least financially secure more conservative than those who are better off: 44% of the least secure say immigrants are a burden on the U.S. because “they take our jobs, housing and health care.” That is considerably higher than the share of the most financially secure (27%) who express this view. Yet negative views about immigrants are more strongly correlated with vote preference among the financially secure than among the insecure.
Looking at all of the 10 values in combination, we see that many of the less financially secure tend to hold more liberal than conservative values, but significant numbers – fully half among the least secure – hold a mix of liberal and conservative values. This adds up to a portrait of a segment of the public that is significantly cross-pressured with regard to its underlying political attitudes or simply is more random in its beliefs and values than is true among the better-off. The holding of conflicting values may lead some to feel uncomfortable in either political party. And randomness in beliefs simply deprives individuals of a compelling logic for making political choices and getting politically involved.
It’s important to note that this analysis makes no claim that financial stress is the principal cause of political disengagement. Many other factors, some of which are related to financial situation (such as educational achievement), also affect an individual’s level of interest and participation in politics. But financial stress has a significant independent impact on political choices and engagement, perhaps by limiting the resources needed to participate effectively and the time and cognitive focus available for political activity. Apart from the question of how one’s financial situation influences political attitudes and behavior, this analysis documents how the financially secure and insecure differ in their political choices and their political impact.
Who Are the Financially Insecure?
The least financially secure Americans are more likely than other people to be female, non-white, unmarried and to have a health condition that limits their ability to work around the house or at a job. They are also less educated and younger than those with more financial stability.
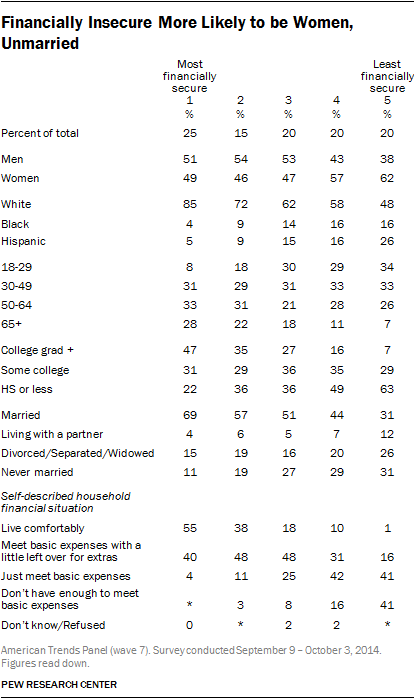
More than six-in-ten (62%) of the least financially secure are women and many are racial or ethnic minorities. Only about half (48%) are white non-Hispanics. Fully 31% of the least financially secure have never married, about three times more than among the most financially secure. A plurality (43%) of the least financially secure Americans are unmarried women, compared with 18% among the most financially secure.
Nearly half (47%) of the most financially secure have a college degree or higher, compared with just 7% of the least financially secure Americans. Nearly two-thirds (63%) of the financially insecure have a high school diploma or less, compared with about half (49%) among those in the next group on the financial security scale. While at least three-in-ten of those at all levels of financial security have some college experience, college graduation rates are the distinguishing factor among them.
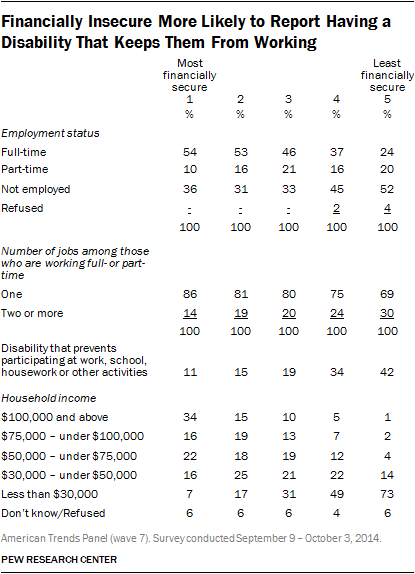
About half (52%) of the least financially secure Americans are not employed, with 24% employed full time and another 20% employed only part-time. By contrast, among those who experience high to moderate levels of financial security (groups 1, 2 and 3 of the financial security scale), about half are employed full time, and only a third of each group are not employed.
Nearly one third (30%) of financially insecure Americans who are employed are working multiple jobs, compared to 14% of those who are the most financially secure.
Disabling health conditions are strongly associated with financial circumstances. Among the most financially secure, just 11% report having a condition that prevents them from participating fully at work, school or home. Among the least secure group, 42% report such a condition.


