Survey Report
With just four days before the midterm elections, the spotlight understandably is focused on the estimated 40% of voting age adults who are expected to show up at the polls next Tuesday. There has been less attention on the much larger share who most probably will not.
As in past elections, nonvoters 1 – those who are either not registered to vote or are considered unlikely to vote in the upcoming midterms – are very different demographically from likely voters:
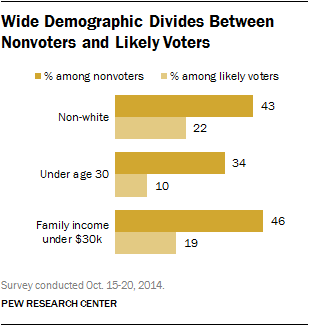
They’re younger. Roughly a third (34%) of nonvoters are younger than 30 and most (70%) are under 50; among likely voters, just 10% are younger than 30 and only 39% are under 50.
They’re more racially and ethnically diverse. Fully 43% of those who are not likely to cast ballots Tuesday are Hispanic, African American or other racial and ethnic minorities, roughly double the percentage among likely voters (22%).
They’re less affluent and less educated. Nearly half of nonvoters (46%) have family incomes less than $30,000, compared with 19% of likely voters. Most nonvoters (54%) have not attended college; 72% of likely voters have completed at least some college.
These demographic differences are not new; similar gaps were seen between the likely electorate and nonvoters in 2012 and 2010. Yet this new analysis, based on an October national telephone survey by the Pew Research Center for the People & the Press and a September wave of the American Trends Panel, underscores the vast gulf in financial well-being between voters and nonvoters.
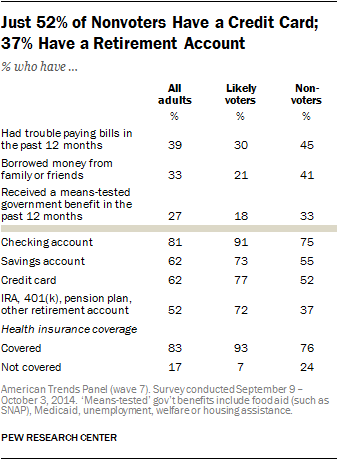
Fully 45% of nonvoters say they have had trouble paying bills in the past year, compared with 30% of likely voters. Nonvoters are also much more likely than voters to borrow money from family or friends (41% vs. 21%) and to receive a means-tested government benefit (33% vs. 18%).
And many nonvoters lack the financial tools commonplace in today’s economy: Just 52% say they have a credit card, while about as many (55%) have a savings account. And just 37% of nonvoters say they have a 401(k) or another retirement account; among the older and more financially secure likely voters, 72% have a retirement account.
Nonvoters’ Weak Partisan Ties
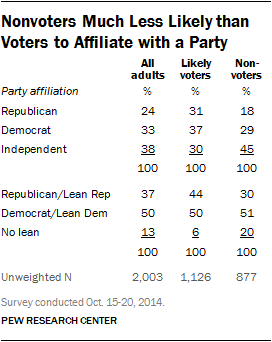
Reflecting their low levels of political engagement, only about half of nonvoters (47%) identify with either political party; 29% identify as Democrats, 18% as Republicans while 45% are independents. Among likely voters, 68% identify with a party (37% Democrat, 31% Republican) and just 30% are independents.
Taking into account the party leanings of independents, about half of nonvoters (51%) either identify as Democrats or lean Democratic; just 30% affiliate with the GOP or lean Republican, while 20% do not lean toward either party. Among likely voters, 50% identify as Democrats or lean Democratic, 44% identify as Republicans or lean Republican, and just 6% have no party leanings.
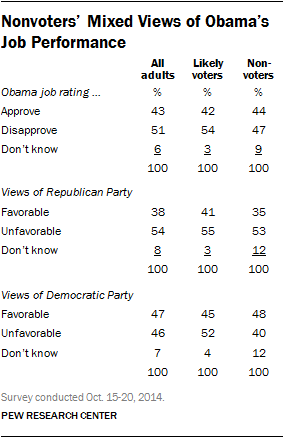
Nonvoters do not have particularly positive views of President Obama’s job performance, or of either political party. About as many approve (44%) as disapprove of the way Obama is handling his job as president.
Nonvoters’ views of the Democratic Party are more favorable than unfavorable. Still, only about half (48%) view the party favorably, while 40% have an unfavorable impression. Among likely voters, both parties are viewed negatively, on balance.
Modest Differences Between Nonvoters, Voters on Selected Issues
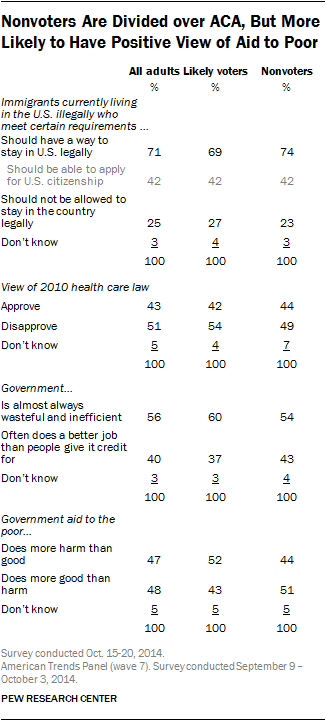
On a few specific issues, differences between voters and nonvoters are relatively modest. Voters and nonvoters hold similar views on what to do about undocumented immigrants living in the U.S. Just 27% of voters, and 23% of nonvoters, believe that undocumented immigrants should be required to leave the U.S.
Skepticism about government performance is nearly as strong among nonvoters as it is among likely voters. Voters and nonvoters are about equally likely to say government is almost always wasteful and inefficient (60% among voters, 54% among nonvoters). On the specific issue of the 2010 health care law, 42% of voters approve, while just over half (54%) disapprove. Even though nonvoters are more likely to be uninsured, and thus to be eligible for the law’s benefits, they too are divided on its merits: 44% say they approve of the law, 49% disapprove.
However, on another issue related to the social safety net, more nonvoters say that government aid to the poor does more good than harm than say the opposite (51% vs. 43%). Likely voters, by 52% to 43%, say that government aid to the poor does more harm than good.
Demographics of Nonvoters: A Deeper Look
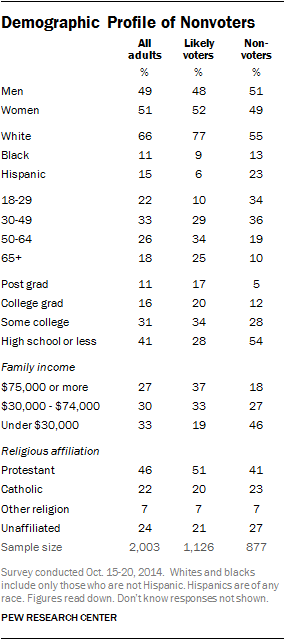
Nonvoters are younger, less educated and less affluent than are likely voters. More than half (54%) of nonvoters have a high school diploma or less, compared to 28% among likely voters. Nonvoters are also far less likely to have a post graduate degree (5% of nonvoters, 17% of likely voters).
Low education levels and low incomes go hand-in-hand: 46% of nonvoters have family incomes under $30,000, compared with just 19% among likely voters.
A much higher proportion of nonvoters identify as racial or ethnic minorities than voters. Only 6% of likely voters identify as Hispanic or Latino, compared to 23% of nonvoters. Three quarters (77%) of likely voters are white, compared with just 55% among nonvoters.
Fewer nonvoters than voters are affiliated with a religion. Among voters, 21% identify as atheist, agnostic, or “nothing in particular”; among nonvoters, it’s 27%.


