Survey Report
The Pew Research Center has developed a new tool for looking at the 2014 elections – a panel survey that enables us to check in with the same representative group of Americans several times during the course of the campaign. This survey includes far more information about respondents than is found in a typical election poll: Their underlying attitudes on a wide range of political issues, drawn from the largest political survey in the Center’s history; a track of voter preferences over the course of 2014; and a link to their actual voting histories.
The new wave of the panel survey was conducted Sept. 9-Oct. 3 with 3,154 adults who are part of the Pew Research Center’s American Trends Panel, a nationally representative group of randomly selected U.S. adults surveyed online and by mail. These respondents are a subset of the more than 10,000 adults interviewed earlier this year as part of a year-long series of reports on political polarization in the American public.
Here are the key findings from the latest wave of the panel survey:
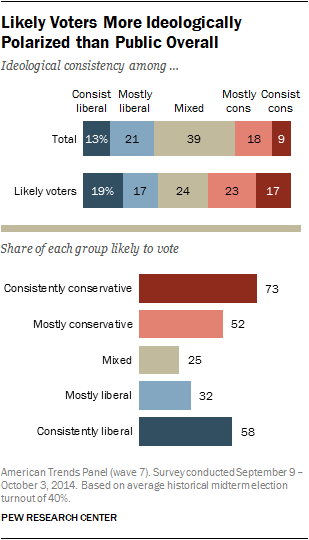
The likely electorate is more polarized than the public. As we noted in our first major report on political polarization, the most ideologically-oriented Americans are also the most politically active, while many in the center “remain on the edges of the political playing field.” This is the case when it comes to which ideological groups are most likely to vote on Nov. 4.
The Pew Research Center’s American Trends Panel
Earlier this year, the Pew Research Center released a major analysis of changes in the American electorate titled Political Polarization in the American Public. The study, based on interviews with over 10,000 adults nationwide, tracked the growing ideological consistency and partisan antipathy expressed by Americans, and how these views correlate with people’s willingness to compromise, relations with friends and family, and even where they prefer to live.
This report is based on a follow-up survey, conducted Sept. 9-Oct. 3 among 3,154 adults who are part of the Pew Research Center’s American Trends Panel, a nationally representative panel of randomly selected U.S. adults surveyed online and by mail. Many panelists had also been interviewed about the election two previous times over the course of 2014, allowing us to make conclusions about change over time. Most (about 80%) were also matched to a large national database of voter records, adding additional depth to the analysis.
Those who are consistently conservative and liberal, who together make up only about one-in-five (22%) in the general public, make up 36% of those most likely to vote. By contrast, those with mixed opinions will be only 24% of the electorate, although they constitute 39% of the general public. (Click here for details about how ideological consistency is measured.)
Although overall turnout among the public is likely to be around 40%, 73% of those who hold consistently conservative attitudes are likely to vote in the midterm, as are 52% of those with mostly conservative views. As other surveys have found, voters on the left are less politically engaged in this election: 58% of those with consistently liberal views and just 32% of those with mostly liberal attitudes are likely to turn out. And among those with about an equal mix of conservative and liberal attitudes, just 25% are likely to go to the polls.
Hostility toward the opposing party is a key marker of polarization and a strong motivator for voting, especially among Republicans. Both Republicans and Democrats have long held negative views of the opposite party. But the level of partisan hostility has grown dramatically in the past 20 years. The new panel survey finds a strong link between having a highly negative reaction to the opposing party and likelihood of turning out to vote, particularly among Republicans.
Among Republicans and Republican leaners with a very unfavorable view of the Democratic Party in the current survey, 65% are likely voters; among Republicans and GOP leaners who have mostly unfavorable views of the Democratic Party, just 40% are likely to vote. Among Democrats and Democratic leaners, 49% of those with very unfavorable opinions of the GOP are likely to vote, compared with 33% of those with mostly unfavorable views.
Voting preferences have been fairly stable in this relatively low profile midterm election year. Roughly nine-in-ten respondents who said they were voting Democratic in June are still leaning Democrat; about as many Republicans say the same. Among likely voters, however, shifts among the relatively small number of undecided or third-party voters in June slightly favor the Republicans.
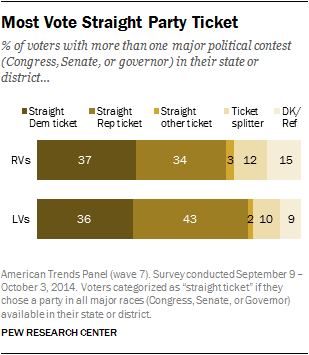
Ticket splitting? Don’t expect much. The survey suggests that voters who split their ballot between Republicans and Democrats will be relatively rare in the states and districts where there are tickets to be split. An analysis of likely voters living in areas with two or three major political contests this fall suggests about eight-in-ten voters (81%) will vote a straight party ticket.
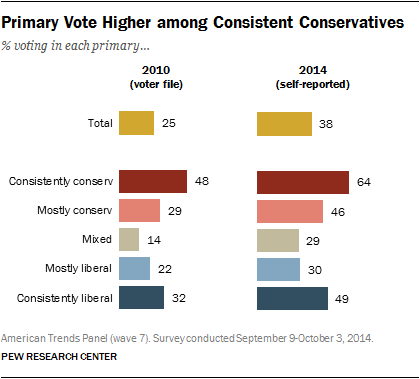
Who voted in the primaries? Highest reported rate: consistent conservatives. Primaries often hold the key to the general election, in that they determine the choices available to voters. Is there polarization there? Absolutely. We find that 64% of consistent conservatives reported voting in a primary election this year, compared with 49% of consistent liberals. The self-reported turnout numbers are lower among those with ‘mostly’ conservative or liberal views, though the pattern of higher turnout on the right remains, with 46 percent of ‘mostly conservative’ voters having cast a primary ballot and 30 percent of ‘mostly liberal’ voters.
Ideological Consistency and the 2014 Vote
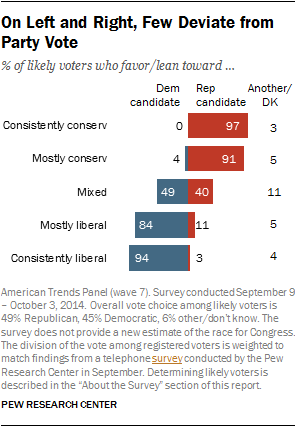
Vote choices are strongly related to voters’ underlying political attitudes and values, as evidenced by the fact that ideologically consistent voters are nearly uniformly supportive of the candidates of their respective political parties. Among likely voters who are consistent conservatives, 97% say they will vote for the Republican candidate for U.S. House in their district; 91% of those with mostly conservative opinions will also do so. Among those with consistently liberal views, 94% say they will vote Democratic, followed by 84% among those with mostly liberal views.
Likely voters with ideologically mixed views divide more evenly (49% Democratic, 40% Republican).
Vote Intentions Largely Stable in 2014
Despite the intense campaign that has raged throughout 2014, and the national and international events that many observers believe have roiled the political landscape, preferences for Democratic or Republican candidates for Congress have remained unchanged for the vast majority of voters this year.1
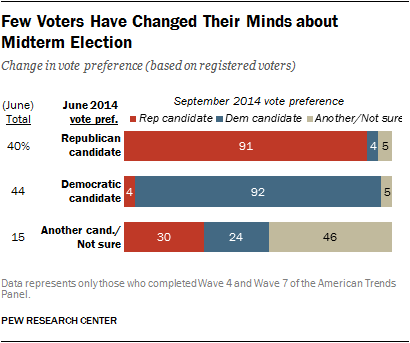
Members of the American Trends Panel were first asked in February for their preference in the election for U.S. House, and again in June. Among registered voters in the current survey, very few report a difference choice today than in June or in February.
Republicans retain 91% of those who said in the June survey that they would choose the Republican candidate for Congress, while 92% of voters who chose a Democrat for Congress in June remain committed to a Democratic candidate. About half of voters who chose a third party candidate or were not sure of their vote in June now support one of the two major parties in October, splitting about evenly between Republicans and Democrats (30% Republican, 24% Democratic).
Among likely voters, however, shifts among third party or undecided voters have slightly favored the Republicans, adding perhaps one point to their advantage over the Democrats.
Partisan Antipathy a Powerful Motivator
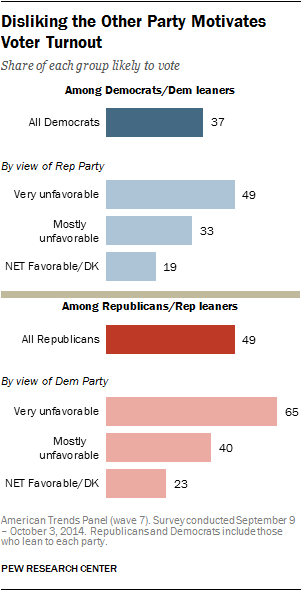
Hostility to the opposing party is a key marker of polarization and is a strong motivator to vote, especially among conservatives and Republicans. Ideology and partisan antipathy are related: Those holding ideologically consistent opinions are far more likely than others to view the opposing party negatively, and even to view it as a threat to the nation’s well-being.
Among Republicans and Republican leaners with a very unfavorable view of the Democratic Party in the current survey, 65% are likely voters, compared with only 49% among Democrats with a very unfavorable view of the Republican Party. Those who are less hostile to the opposite party are considerably less likely to vote. Among Republicans, 40% of those with a mostly unfavorable view of Democrats are likely to vote, and only 23% of those with positive views (or who offer no opinion) of the Democratic Party are likely to vote. On the other side, 33% of Democrats with a mostly unfavorable view of the Republican Party are forecasted to turn out, as are 19% of those with positive views of (or no opinion about) the GOP.
Ticket Splitters Rare among Voters in Either Party
As voters become more polarized ideologically, fewer opt to select candidates from more than one political party when they go to the polls. According to the American National Election Study, ticket-splitting reached an all-time low in 2012 with only 13% of voters selecting a different political party for the U.S. Senate than the U.S. House.
An analysis of voters living in areas with two or three major political contests this November shows that only 12% of registered voters say they are splitting their vote between multiple political parties. About three-quarters of registered voters (74%) in these areas say they will select candidates from the same party for all major political races in their area, known as “straight ticket” voting.2
When narrowed to those most likely to vote in the November election, about eight-in-ten voters (81%) choose a straight party ticket. They are slightly more likely to select only Republican candidates than only Democratic candidates (43% to 36%).
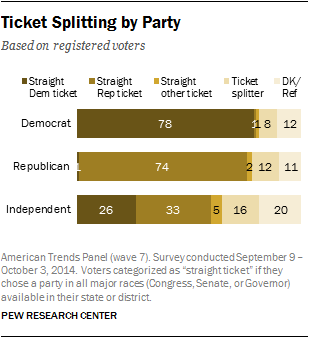
Majorities of Democratic (78%) and Republican (74%) registered voters are voting straight down their party’s ticket for major races. Even among self-identified independents who are registered to vote, 65% say they will vote a straight ticket. Independents are seven points slightly more likely to choose a straight Republican ticket than a straight Democratic ticket (33% to 26%).
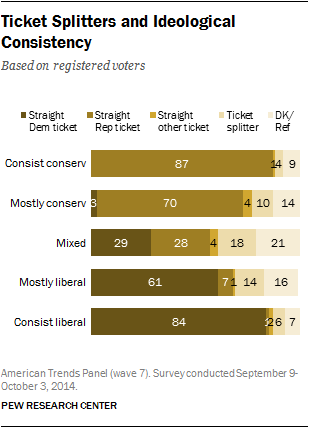
Voters who hold consistent ideological viewpoints are highly likely to vote a straight party ticket. Nearly nine-in-ten (87%) with consistently conservative views choose Republican candidates down the line, while 84% of those with consistently liberal views choose a straight Democratic ticket.
Even among voters with ideologically mixed views, most (61%) still choose a slate of candidates from one party; 18% split their tickets between parties.
Primary Voting and Polarization
Consistent conservatives are considerably more likely than consistent liberals and those in other groups to report voting in the 2014 primaries. Looking at the approximately 80% of panelists for whom a record exists in the voter file, the same pattern is true in 2010.
Asked about voting in this year’s primary elections, 38% of those surveyed say they have voted. (Self-reported voting rates tend to be considerably higher than actual turnout.) This varies from 29% among those with ideologically mixed opinions to 64% among those with consistently conservative views. Among those with consistently liberal opinions, 49% say they voted in a primary. Among those with mostly conservative views, 46% say they voted in a primary. Among those with mostly liberal opinions, 30% say they voted.
The pattern was very similar in the 2010 primaries, based on voter records, but the estimated level of turnout is considerably lower than 2014 self-reports (25% of those matched to the voter file were recorded as voting in a primary). Consistent conservatives again stand out, with 48% recorded as having voted in a primary in 2010, compared with 32% among consistent liberals, 29% among those with mostly conservative views, 22% among those with consistent liberal views and just 14% among those with mixed views.
These patterns of turnout mean that conservatives and liberals make up a larger majority of primary voters than they do among all partisans in the general public. Among Republicans and those who lean Republican, 69% of 2014 primary voters (and 77% in 2010) are either consistently or mostly conservative in their views. Among Democrats and leaners, 64% in 2014 (and 75% in 2010) are consistently or mostly liberal. To be sure, most partisans tilt in the ideological direction of their party. But primaries exaggerate this tilt.
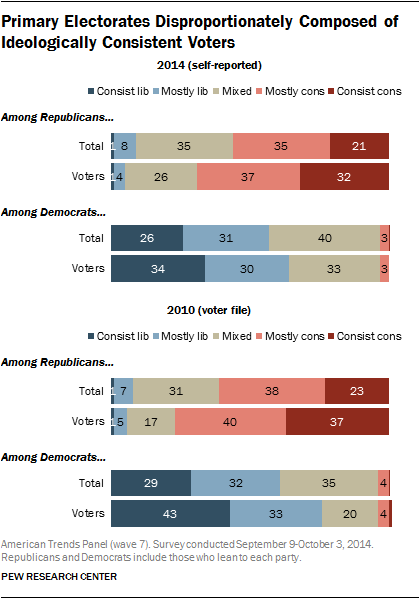
Nonetheless, the most ideological voters still do not constitute a majority within their own party’s primary electorates.
Among Republicans and those who lean Republican, consistent conservatives constitute 32% of self-reported 2014 primary voters and 37% of 2010 primary voters in the voter file, compared with 21% and 23% overall among Republicans. Similarly, among Democrats, consistent liberals make up 34% of those who say they voted in the 2014 primary and 42% among 2010 voters in the voter file; by comparison, they constitute 26% and 29% of all Democrats and leaners of the general public in 2014 and 2010, respectively.
Party as a Motivator of the Vote
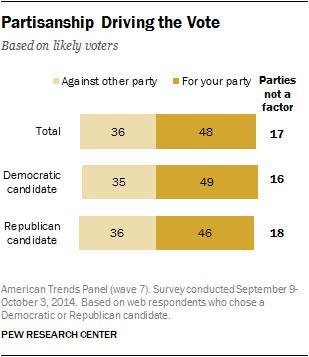
In a year where spending on political ad spending is poised to break $1 billion, with nearly half of that being spent on negative ads, more than a third of likely voters (36%) say that negativity toward the opposing party is driving their vote on Election Day. This number is about the same among supporters of Republican and Democratic candidates this November. About half of voters (48%) view their choice as a vote in favor of their own party.
Ideologically consistent voters are more likely to see party as a factor in their vote this November; only 10% of each group say party is not a factor.
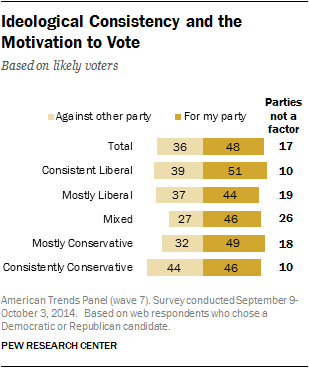
Those voters who hold ideologically mixed viewpoints are less likely than the average to see their vote in partisan terms (26% say the parties are not a factor). A 46% plurality say that voting for their party is the driving factor in their vote, while 27% say they are voting against the other party.
On both sides, the plurality reason of support for one’s party is shared values (38% of Republicans and 45% of Democrats say this). However, hostility towards the opposing party still seems to be a driving force in the vote, even for those who say their vote is for their own party. Among Republicans, the number two reason for voting in favor of their own party is disagreement with Democrats (17%). Similarly, 8% of Democrats say that disagreement with Republicans is a top reason to vote for the Democratic Party.
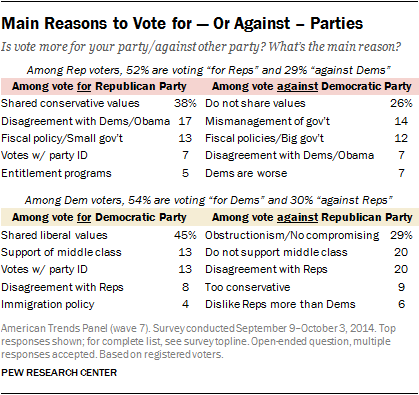
Among Republican voters who are voting more against the Democrats, about one-in-four (26%) mainly say it’s because they do not share the same values. In addition, 14% mention the Democrats’ government mismanagement and 12% specifically name fiscal policies and disagreements about the size of government.
The top issue for Democrats who consider their vote as against the Republicans is the GOP’s obstructionism and lack of compromise (29%). And two-in-ten (20%) each cite the Republican Party’s lack of support for the middle class and overall disagreement with the party’s platform.

