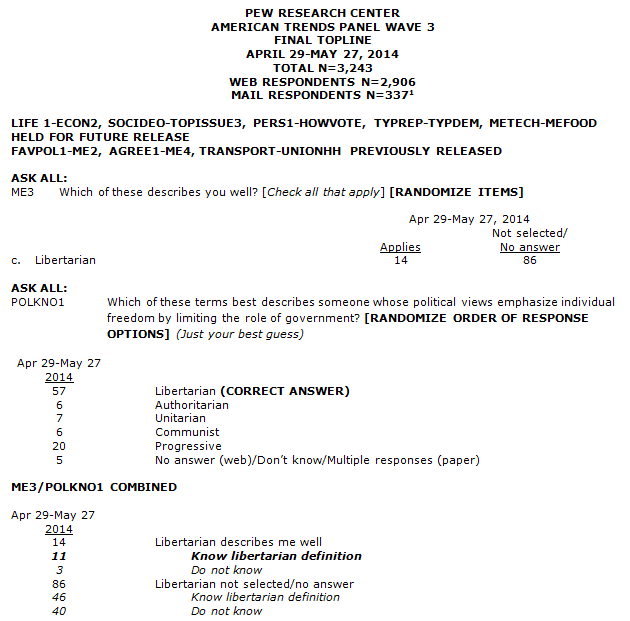
Survey Topline
About the Surveys
The data in this report are based on two independent survey administrations with the same randomly selected, nationally representative group of respondents. The first is the center’s largest survey on domestic politics to date: the 2014 Political Polarization and Typology Survey, a telephone survey of just over 10,000 Americans. The second involved impaneling a subset of these respondents into the newly created American Trends Panel and following up with them via a survey conducted by web and telephone. For detailed information about the 2014 Political Polarization and Typology Survey, see https://www.pewresearch.org/politics/2014/06/12/about-the-surveys-25/. The panel survey is described in further detail in the section that follows.
The American Trends Panel (ATP), created by the Pew Research Center, is a nationally representative panel of randomly selected U.S. adults living in households. Respondents who self-identify as internet users (representing 89% of U.S. adults) participate in the panel via monthly self-administered Web surveys, and those who do not use the internet participate via telephone or mail. The panel is being managed by Abt SRBI.
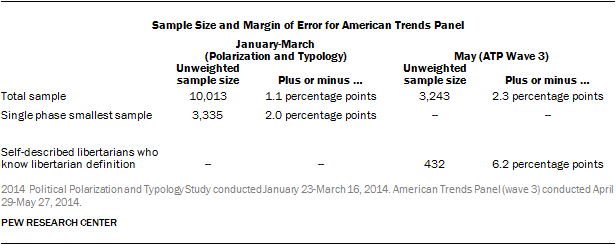
Data in this report are drawn from the May wave of the panel, conducted April 29-May 27, 2014 among 3,243 respondents (2,906 by web and 337 by mail). The margin of sampling error for the full sample of 3,243 respondents is plus or minus 2.3 percentage points.
[1]
Of the 10,013 adults interviewed, 9,809 were invited to take part in the panel. A total of 5,338 agreed to participate and provided either a mailing address or an email address to which a welcome packet, a monetary incentive and future survey invitations could be sent. Panelists also receive a small monetary incentive after participating in each wave of the survey.
The ATP data were weighted in a multi-step process that begins with a base weight incorporating the respondents’ original survey selection probability and the fact that some panelists were subsampled for invitation to the panel. Next, an adjustment was made for the fact that the propensity to join the panel varied across different groups in the sample. The final step in the weighting uses an iterative technique that matches gender, age, education, race, Hispanic origin, telephone service, population density and region to parameters from the U.S. Census Bureau’s 2012 American Community Survey. It also adjusts for party affiliation using an average of the three most recent Pew Research Center general public telephone surveys, and for internet use using as a parameter a measure from the 2014 Survey of Political Polarization. Sampling errors and statistical tests of significance take into account the effect of weighting. In addition to sampling error, one should bear in mind that question wording and practical difficulties in conducting surveys can introduce error or bias into the findings of opinion polls.
The Web component of the May wave had a response rate of 61% (2,906 responses among 4,740 Web-based individuals enrolled in the panel); the mail component had a response rate of 61% (337 responses among 553 non-Web individuals enrolled in the panel). Taking account of the response rate for the 2014 Survey of Political Polarization (10.6%), the cumulative response rate for the May ATP wave is 3.5%.
The accompanying table shows the unweighted sample sizes and the error attributable to sampling that would be expected at the 95% level of confidence for groups discussed in the report and in the detailed tables provided below.
[1]
