Steadfast Conservatives
12% OF ADULT POPULATION / 15% OF REGISTERED VOTERS / 19% OF VERY ENGAGED
- 84% Rep/Lean Rep (56% Rep, 28% Lean Rep)
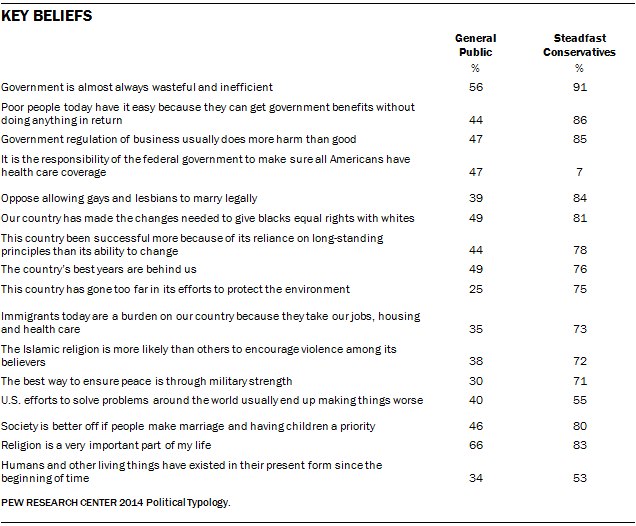
Basic description: This overwhelmingly Republican group holds very conservative attitudes across most issues, including social policy and the size and scope of government. However, they are critical of business and Wall Street. Steadfast Conservatives also express highly negative attitudes toward immigrants and take a skeptical view of U.S. global involvement.
Defining values: Among all typology groups, Staunch Conservatives are the most likely to say they are angry with the federal government. Just 12% favor same-sex marriage and 24% support legal abortion – the lowest shares of any group. Fully 81% of Steadfast Conservatives think that “the growing number of newcomers from other countries threatens traditional American customs and values.” Most think that U.S. efforts to solve global problems usually make things worse and just 39% think free trade agreements are good for the United States, the lowest percentage of any group.
Political attitudes: Steadfast Conservatives are highly engaged in politics: fully 74% say they always or nearly always vote in primary elections. They overwhelmingly supported Mitt Romney in 2012; this year, 88% support the Republican candidate in their congressional district. Steadfast Conservatives have favorable opinions of several possible GOP candidates in 2016, but just 44% have a favorable view of New Jersey Gov. Chris Christie.
Who they are: Nearly nine-in-ten (87%) are non-Hispanic white and 59% are male. Steadfast Conservatives are the oldest typology group (31% are 65 or older) and have the highest share of white evangelical Protestants (43%). They are less educated and have lower family incomes than Business Conservatives. Still, 64% of Steadfast Conservatives say “paying the bills is generally not a problem.”
Lifestyle notes: Many are regular churchgoers (55% attend religious services at least weekly), while 52% have a gun in their households.
Business Conservatives
10% OF ADULT POPULATION / 12% OF REGISTERED VOTERS / 17% OF VERY ENGAGED
- 86% Rep/Lean Rep (49% Rep, 37% Lean Rep)
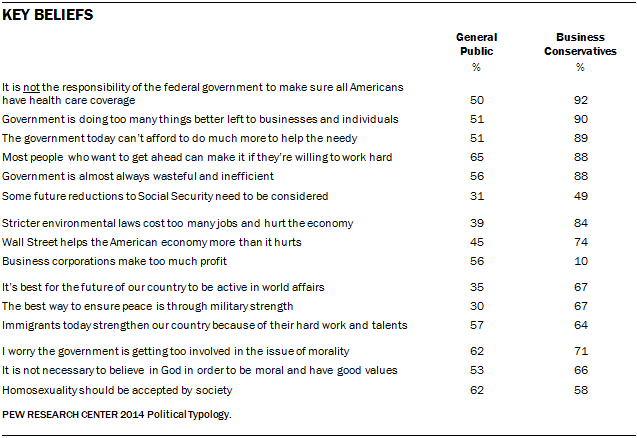
Basic description: Business Conservatives are traditional small-government Republicans. Overwhelming percentages think that government is almost always wasteful and it does too much better left to businesses and individuals. Business Conservatives differ from Steadfast Conservatives in their strong support for Wall Street and business more generally. There are other important differences as well: Most Business Conservatives think that immigrants strengthen the country and take a positive view of U.S. global involvement. They are less socially conservative than Steadfast Conservatives.
Defining values: Business Conservatives are more likely than other typology groups to identify as “libertarians,” though just 27% say that term describes them well. Their political values and attitudes do reflect a libertarian philosophy in some respects, though there are important differences as well. They are the only group in which a majority (67%) believes the economic system is fair to most Americans rather than unfairly tilted in favor of the powerful. Business Conservatives are not liberal on most social issues, but they are more progressive than Steadfast Conservatives. For instance, while nearly half of Business Conservatives (49%) oppose same-sex marriage, 58% say homosexuality should be accepted rather than discouraged.
Political attitudes: They have favorable impressions of several possible GOP candidates in 2016, but they are most favorable toward Rep. Paul Ryan (79% favorable). Business Conservatives also are more likely than Steadfast Conservatives to have a favorable view of New Jersey Gov. Christ Christie (56% vs. 44%). They are knowledgeable about politics and are politically engaged – 71% say they always or nearly always vote in primary elections.
Who they are: Business Conservatives are the most affluent typology group – 45% have family incomes of $75,000 or more; 28% have incomes of at least $100,000. Most Business Conservatives are 50 or older, but as a group they are not as old as Steadfast Conservatives. Most are white non-Hispanic (85%) and male (62%). Roughly three-quarters (77%) of Business Conservatives have attended college and 43% have a four-year degree. Among Steadfast Conservatives, only about half (54%) have been to college and just 21% have completed their degrees.
Lifestyle notes: Most Business Conservatives live in the suburbs (54%). Two-thirds of Business Conservatives (68%) have investments in the stock market and 57% say they are interested in business and finance – both figures are highest among typology groups.
Young Outsiders
14% OF ADULT POPULATION, 15% OF REGISTERED VOTERS, 11% OF VERY ENGAGED
- 49% Rep/Lean Rep (23% Rep, 26% Lean Rep); 35% Dem/Lean Dem
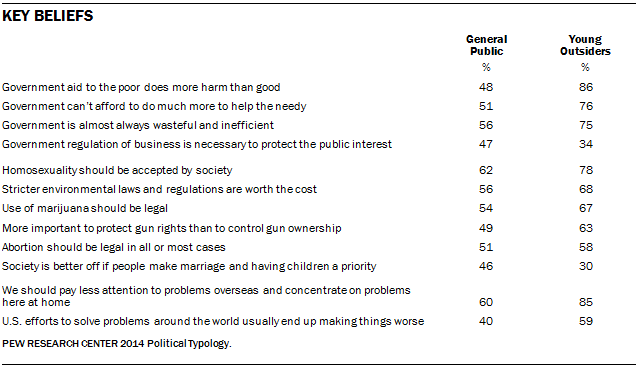
Basic description: This relatively young, largely independent group holds a mix of conservative and liberal views. And while more lean toward the Republican Party than the Democratic Party, Young Outsiders express unfavorable opinions of both major parties. They are skeptical of activist government; a substantial majority views government as wasteful and inefficient. Yet they diverge from the two conservative typology groups – Steadfast Conservatives and Business Conservatives – in their strong support for the environment and many liberal social policies.
Defining values: A large majority ofYoung Outsiders (81%) think “poor people today have it easy because they can get government benefits without doing anything in return.” That is among the highest share of any typology group. Two-thirds (66%) say government is doing too much to solve problems, while only about half as many (32%) want it to do more. Yet most Young Outsiders favor government action to protect the environment; 68% say stricter environmental laws are worth the cost. Majorities of Young Outsiders favor same-sex marriage (68%) and legalizing marijuana (67%), while 58% say abortion should be legal in all or most cases. However, they also are strong supporters of gun rights. About six-in-ten (63%) say it is more important to protect the right of Americans to own guns while just 35% think it is more important to control gun ownership.
Political attitudes: In this fall’s midterms, Young Outsiders favor the Republican in their district by 53% to 33%. Yet they are not deeply engaged in politics. Only 42% say they follow what’s going on in politics and government most of the time, and just 30% know that Democrats have a majority in the Senate and that Republicans control the House. Young Outsiders have divided views of many political figures; no leading Republican is viewed more positively than negatively.
Who they are: Young Outsiders are one of the youngest typology groups; 30% are under 30 and most are under 50. About three-quarters (73%) are non-Hispanic whites, and about as many are male (48%) as female (52%). They are relatively secure financially, for their age profile, and most (63%) say “paying the bills is generally not a problem.”
Lifestyle notes: Young Outsiders are detached from religion as well as politics. Just 25% say they attend religious services at least weekly. Most Young Outsiders say it is important to live in a community with high quality public schools and where they can live near extended family. Relatively few place priority on living near people who share their religious faith (23%) or political views (18%).
Hard-Pressed Skeptics
13% OF ADULT POPULATION, 13% OF REGISTERED VOTERS, 9% OF VERY ENGAGED
- 53% Dem/Lean Dem (37% Dem, 16% Lean Dem); 32% Rep/Lean Rep
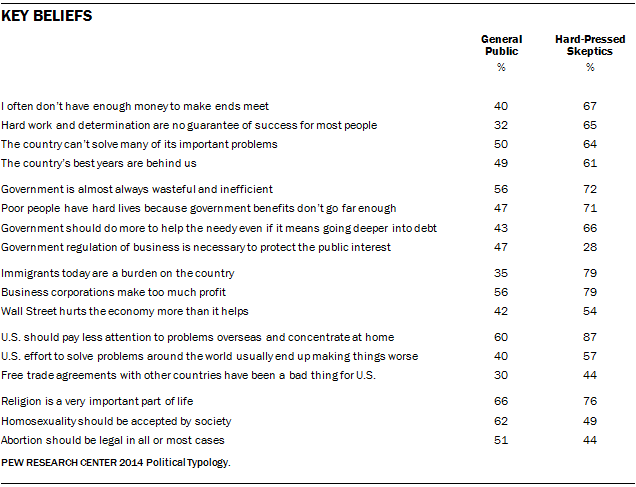
Basic description: Deeply financially-stressed and distrustful of government, Hard-Pressed Skeptics lean toward the Democratic Party but have reservations about both political parties. They want government to do more to solve problems, but have doubts about its efficiency. Hard-Pressed Skeptics are dissatisfied with conditions in the country and their communities. They are among the most cynical about the ability of individuals to improve their lot through hard work. These attitudes may reflect their distressed financial conditions: Hard-Pressed Skeptics have the lowest family incomes of any of the typology groups.
Defining values: Seven-in-ten (71%) Hard-Pressed Skeptics say the poor have hard lives because government benefits don’t go far enough to help them live decently. Despite their strong support for a government safety net, however, most take a dim view of government performance. Fully 72% say government is wasteful and inefficient, far higher than any other Democratic-leaning group. Their opinions about business and Wall Street are equally negative. More generally, 74% think the U.S. economic system favors powerful interests. About eight-in-ten (79%) view immigrants as a burden on the country. They also are wary of U.S. global involvement. An overwhelming 87% of Hard-Pressed Skeptics think the U.S. should pay less attention to overseas problems and concentrate more on problems at home.
Political attitudes: Just 39% of Hard-Pressed Skeptics say they are interested in government and politics, the lowest percentage of any typology group. Fewer than a quarter (23%) are aware of which parties control the House and Senate. In 2012, 62% of registered voters in this group say they voted for Barack Obama. But today, just 44% of Hard-Pressed Skeptics approve of Obama’s job performance. Just 26% have a favorable view of House Minority Leader Nancy Pelosi while 39% view her unfavorably. But Hillary Clinton is popular with Hard-Pressed Skeptics: 62% have a favorable impression of Clinton.
Who they are: About six-in-ten (61%) are non-Hispanic whites; 20% are black, while 9% are Hispanic. Hard-Pressed Skeptics have the highest share of women (58%) of any typology group. Just 9% are college graduates, by far the lowest percentage of all the groups; 60% have no more than a high school education. More than half (56%) have annual family incomes less than $30,000. About half (51%) are 50 or older, which is somewhat higher than the share of older Americans in the public (44%).
Lifestyle notes: Only about a third of Hard-Pressed Skeptics (32%) say they work-full-time. Nearly half (46%) live in the suburbs, but more express a preference for living in a small town than in a suburb or city.
Next Generation Left
12% OF ADULT POPULATION / 13% OF REGISTERED VOTERS / 11% OF VERY ENGAGED
- 65% Dem/Lean Dem (35% Dem, 29% Lean Dem)
Basic description: Young, well-educated and financially comfortable, the Next Generation Left have very liberal attitudes on many issues, including homosexuality and abortion, the environment and foreign policy. They are supportive of an activist government, but wary of expanding the social safety net. They also have relatively positive views of Wall Street’s impact on the economy. While most affiliate with the Democratic Party or lean Democratic, few consider themselves strong Democrats.
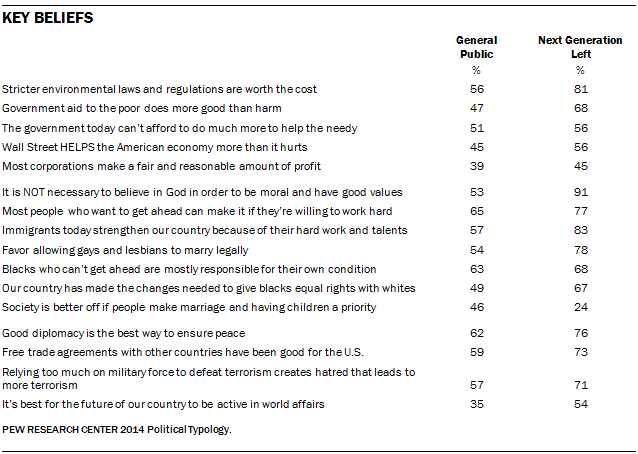
Defining values: Fully 88% of the Next Generation Left say that homosexuality should be accepted by society and 78% favor same-sex marriage. Just 24% believe society is better off if people make getting married and having children a priority. The Next Generation Left are not critical of government – 67% say it “often does a better job than people give it credit for.” And most think government aid to the poor does more good than harm. Yet 56% say the government cannot afford to do much more to help the needy. The Next Generation Left value racial and ethnic diversity, but just 19% think that racial discrimination is holding back many blacks; far more (68%) say blacks who can’t ahead are responsible for their own condition.
Political attitudes: The Next Generation Left were solidly in the Democratic camp in 2012 and are likely to be there again this year – 61% of registered voters support the Democratic candidate for Congress in their district, or lean Democratic, in a 2014 ballot test. However, 49% think the Democratic Party “too often sees government as the only way to solve problems.” Only about a third of the Next Generation Left (35%) are Democrats and just 15% say they are strong Democrats. Still, most (65%) at least lean to the Democratic Party. This group has the highest share of self-described moderates (53%) in the political typology.
Who they are: About two-thirds (68%) are non-Hispanic whites and 15% are Hispanic. One of the two youngest groups, the average age is 41 and a third (33%) are younger than 30. Roughly three-quarters (74%) have some college experience and 62% are financially satisfied.
Lifestyle notes: Only about half of the Next Generation Left (47%) view religion as very important and only about one-in-five (21%) attend services at least weekly. Most (71%) have an interest in science and technology. While 57% say it is important to live close to museums and theaters, an even higher percentage (70%) value access to the outdoors for hiking, fishing and camping.
Faith and Family Left
15% OF ADULT POPULATION, 16% OF REGISTERED VOTERS, 12% OF VERY ENGAGED
- 61% Dem/Lean Dem (46% Dem, 15% Lean Dem)
Basic description: The Faith and Family Left combine strong support for activist government with conservative attitudes on many social issues. They are highly diverse – this is the only typology group that is “majority-minority.” The Faith and Family Left favor increased government aid for the poor even if it adds to the deficit and believe that government should do more to solve national problems. They oppose same-sex marriage and legalizing marijuana. Religion and family are at the center of their lives. Most say it is necessary to believe in God in order to be moral.
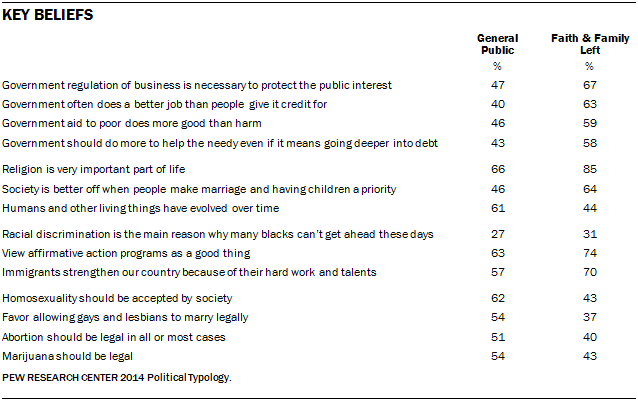
Defining values: Fully 85% of the Faith and Family Left say religion is very important and 51% want the government to do more to protect morality — the highest percentage of any typology group. Most support government aid to the poor: 59% say it does more good than harm because people are unable to escape poverty unless their basic needs are met. Fully 74% support affirmative action programs and just 23% think the country has made needed changes to give blacks equal rights. Yet a majority of the Faith and Family Left (57%) say that blacks who are unable to get ahead are responsible for their own condition.
Political attitudes: Most say they voted for Obama in 2012 and this year 63% of registered voters support the Democratic candidate for Congress in their district. Yet they have the highest share of self-described conservatives (37%) of any Democratic-leaning typology group. Just half know that the GOP has a majority in the House and even fewer (44%) know that Democrats have a majority in the Senate.
Who they are: The Faith and Family Left includes the highest share of African Americans (30%) and Hispanics (19%) of any typology group; they also have the largest share of foreign-born (18%). One of the least educated (54% have no more than a high school education), and lowest income groups (45% make less than $30,000 a year). Roughly half (51%) are 50 and older.
Lifestyle notes: Two-thirds (66%) say they are interested in religion and spirituality. Roughly half (51%) attend services at least weekly. Fully 73% say compassion and helping others are core values. Just 38% are interested in health and fitness, among the lowest shares of any typology group.
Solid Liberals
15% OF ADULT POPULATION / 17% OF REGISTERED VOTERS / 21% OF VERY ENGAGED
- 89% Dem/Lean Dem (61% Dem, 28% Lean Dem)
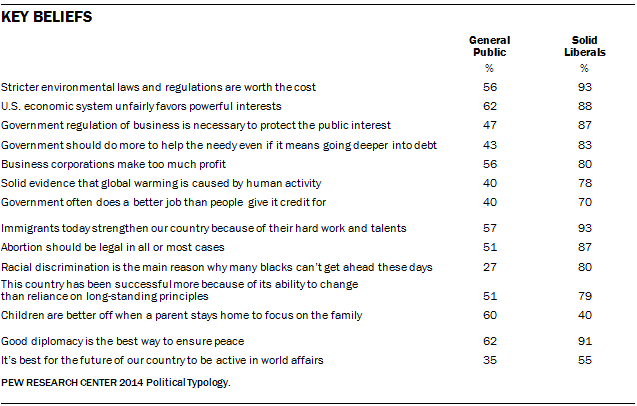
Basic description: Highly educated and affluent, Solid Liberals strongly support the social safety net and take very liberal positions on virtually all issues. Most say they always vote Democratic and they are unflagging supporters of Barack Obama. Solid Liberals are very optimistic about the nation’s future and are the most likely to say that America’s success is linked to its ability to change, rather than its reliance on long-standing principles. On foreign policy, Solid Liberals overwhelmingly believe that good diplomacy – rather than military strength – is the best way to ensure peace; in addition, most say that relying too much on military force to defeat terrorism creates hatred that fuels more terrorism.
Defining values: Fully 83% of Solid Liberals say the government should do more to help the needy, even if it means going deeper into debt. About as many (87%) say government regulation of business is necessary to protect the public interest. An equally large majority (87%) says abortion should be legal in all or most cases; 44% say there should be no restrictions at all on abortion. Nearly six-in-ten (58%) say that religion is not that important to them. Eight-in-ten say racial discrimination is the main reason blacks can’t get ahead; among the public generally, just 27% express this view.
Political attitudes: Solid Liberals strongly backed Barack Obama in 2012 and remain supportive of him today: 84% approve of his job performance, with 51% approving very strongly. Solid Liberals view other leading Democrats positively as well. Nearly nine-in-ten (88%) have a favorable opinion of Hillary Clinton. Sen. Elizabeth Warren is not as well known; still, 61% view the Massachusetts senator favorably while just 9% view her unfavorably. About as many have a very favorable impression of Warren as Clinton (40% Warren, 42% Clinton). While Solid Liberals view many leading Republicans unfavorably, they have especially negative opinions of Sen. Ted Cruz: 2% have a favorable opinion of Cruz, compared with 71% who view him unfavorably – 62% very unfavorably.
Who they are: The most highly educated of the typology groups, 52% have college degrees and 21% have graduate degrees. They also are the most urban group (47% live in urban areas), and are generally satisfied with their financial situation. A majority of Solid Liberals (56%) are women. Nearly half (46%) seldom or never attend religious services.
Lifestyle notes: Solid Liberals prefer an urban lifestyle: 45% say if they could live anywhere they wanted, they would live in a city. And 73% would rather live in a community with smaller houses closer to schools and shopping, than one with larger houses where things are farther apart; that is the highest percentage of any typology group. A large majority (69%) values living in a community that is in close proximity to art museums and theaters. Just 12% say the description “hunter, fisher or sportsman” fits them well, the lowest share of any typology group.
Bystanders
10% OF ADULT POPULATION, 0% OF REGISTERED VOTERS
- 43% Dem/Lean Dem (19% Dem, 24% Lean Dem), 23% Rep/Lean Rep (7% Rep, 16% Lean Rep), 34% Ind/Other no leaning
Basic description: Bystanders are on the sidelines of the political process, either by choice or because they are ineligible to vote. None are currently registered to vote. Most follow government and public affairs only now and then (32%) or hardly at all (32%).
Who they are: Nearly four-in-ten Bystanders (38%) are under 30. About a third (32%) are Hispanic, 10% are black and 48% are non-Hispanic whites. A third were born outside the United States. Bystanders have low levels of education and household income. Two-thirds (67%) have no college experience; just 11% are college graduates. Nearly six-in-ten (58%) have family incomes of $30,000 or less.
Lifestyle notes: Bystanders like the outdoors: 66% think of themselves as an “outdoor person.” In addition, 35% describe themselves as a “video or computer gamer.” Among the public generally, just 21% think of themselves as video gamers. Bystanders are more likely to say they are interested in celebrities and entertainment than the public overall (64% vs. 44%); about two-thirds (64%) are interested in health and medicine, and 50% follow science and technology. Bystanders express relatively low interest in business and finance and, not surprisingly, government and politics.

