In winning reelection, Barack Obama won 60% of the vote among those younger than 30. That was down somewhat from 2008, when Obama won nearly two-thirds (66%) of the votes of young people. However, Obama’s youth support may have been an even more important factor in his victory this year than it was in 2008.
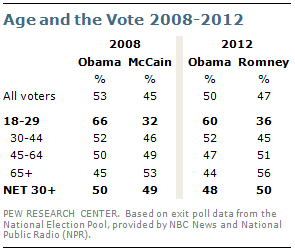
The divide between young voters and older voters was as stark this year as it was in 2008. While Obama lost ground among voters younger than 30, he still won this age group by 24 points over Mitt Romney (60% to 36%). He also maintained a slimmer advantage among voters 30 to 44 (52% Obama, 45% Romney), while losing ground among those 45 to 64 and those 65 and older.
Among all voters 30 and older, Obama ran behind Mitt Romney (48% for Obama, 50% for Romney). Four years ago, Obama edged John McCain, 50% to 49%, among all 30+ voters.
In Florida, Ohio, Virginia and Pennsylvania, Obama also failed to win a majority of voters 30 and older. Yet he swept all four battleground states, in part because he won majorities of 60% or more among young voters.
Just as critically, young people made up as large a share of the overall electorate as they did in 2008, according to the national exit poll (19% in 2012, 18% in 2008). As recently as September, young voters were significantly less engaged in the campaign than they had been four years earlier. But their interest and engagement levels increased in the campaign’s final weeks. In the Pew Research Center’s final pre-election survey, as many registered voters under 30 said they were giving a lot of thought to the election as did so in the last weekend of the 2008 race.
Obama’s support among young voters declined among many of the same subgroups in the overall electorate in which he lost ground, particularly whites, men and independents. Obama won a majority of white non-Hispanics under 30 in 2008, but lost this group to Romney this year. In contrast, Obama won young African Americans and Hispanics by margins that were about as large as in 2008.
His losses among young voters since 2008 might have been even greater, but for the fact that the under 30s are by far the most racially and ethnically diverse age group. Just 58% are white non-Hispanic, compared with 76% of voters older than 30. A recent report by Pew Social and Demographic Trends found that minorities are on track to become a majority of the overall population by 2050.
Young voters continue to identify with the Democratic Party at relatively high levels and express more liberal attitudes on a range of issues – from gay marriage to the role of the federal government – than do older voters. In fact, voters under 30 were as likely to identify as Democrats in the 2012 exit poll as they had been in 2008 (44% now, 45% then). And they are the only age group in which a majority said that the government should do more to solve problems.
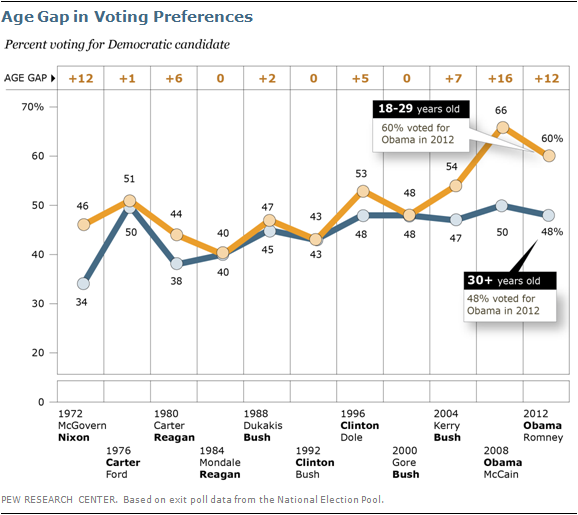
The last two presidential elections have had the widest gaps in voting between young and old of any election since 1972. This year, 60% of those under 30 backed Obama, compared with just 48% of those 30 and older; in 2008, the gap was 16 points (66% of under 30 supported Obama vs. 50% of those 30 and older).
This year’s 12-point difference between old and young this year was identical to the gap in 1972, when 46% of voters 18-29 supported George McGovern compared with just 34% of those 30 and older.
As Pew Research observed a year ago in The Generation Gap and the 2012 Election there were only modest generational differences in presidential vote preferences between 1976 and 2004.
Changes in the Youth Vote: 2008-2012
While Obama carried the youth vote overall, his support declined from 2008 among all young voters and among key subgroups. In particular, Obama lost ground among young whites, men and
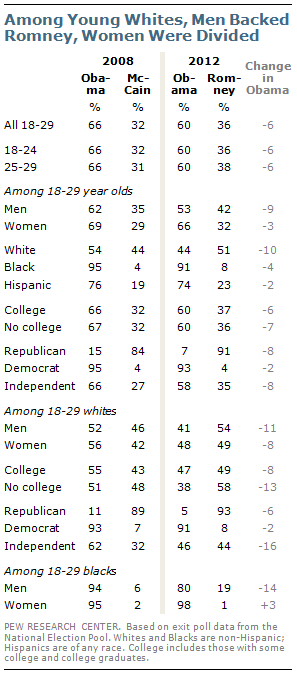
independents.
Only 44% of white voters under 30 backed Obama, while 51% voted for Romney. This is a substantial change compared with 2008, when Obama carried the young white vote by 10 points (54% to 44%). Far more young blacks and Hispanics backed Obama than Romney, and there was little fall off in his support among these groups from 2008.
Obama also lost support among young men. Overall, 53% of men under 30 supported Obama, down from 62% in 2008. Fully 66% of young women voted for Obama, similar to the 69% who voted for him in 2008.
However, Obama lost support among both white men and women. Overall, 41% of white men supported Obama while 54% supported Romney. In 2008, Obama won the vote among white men, 52% to 46%. While white women voted for Obama over McCain by a 56% to 42% margin four years ago, they were divided this year (48% voted for Obama, 49% for Romney).
Surprisingly, Obama’s vote also declined among young black men, by 14 points, while holding steady among young black women.
Youth Vote in Battleground States
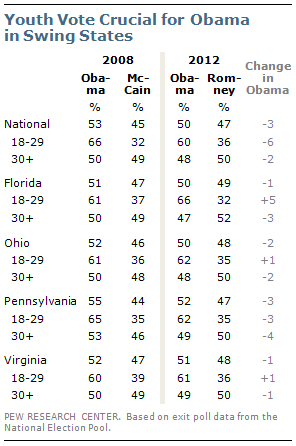
In four of the key battleground states, Obama may not have won without the youth vote. In Florida, 47% of voters 30 and older backed Obama, while 52% supported Romney. But by winning younger voters by two-to-one (66% to 32%), Obama eked out a narrow one-point victory in the state (50% to 49%).
The pattern was similar in Ohio – 48% of voters 30 and older voted for Obama. When younger voters were included, his share of the vote increased to 50% (vs. 48% for Romney). And in both Pennsylvania and Virginia, the youth vote helped push Obama over 50%.
In 2008, Obama won half or more of the vote among those 30 and older in all four states. Thus, he probably would have been able to carry the vote, even with less support from young voters.
The Demography of Young Voters
The racial and ethnic composition of young voters has shifted dramatically over the last four presidential elections. Just 58% of voters age 18-29 identified as white non-Hispanics, while 18% were
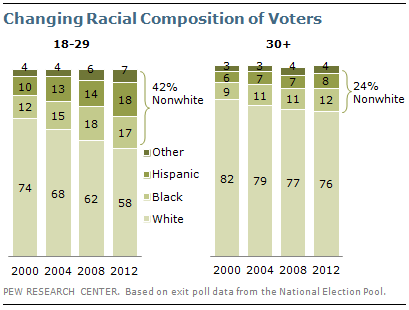
Hispanic, 17% were African American and 7% identified as mixed-race or some other race. The share of young voters who are white has declined 16 points since 2000, when 74% of voters under 30 identified as white and 26% identified as nonwhite (including 12% who were African American and 10% Hispanic).
This stands in sharp contrast to older voters. Fully 76% of voters 30 and older were white, down only six points from 2000. Only 24% of voters 30 and older were nonwhite, including 12% who identified as black and 8% as Hispanic.
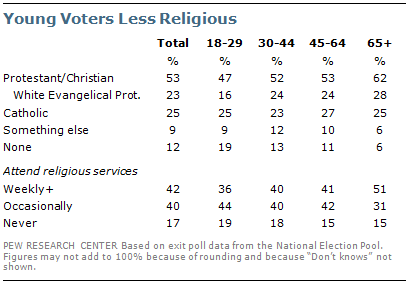
Younger voters also are less likely to be religious than older voters. Only 36% of young voters attend religious services at least weekly, compared with 51% of older voters.
And when it comes to religious affiliation, 47% of young voters say they are Protestant or Christian, but just 16% are white evangelicals. By contrast, 62% of voters 65 and older are Protestant, including 28% who are white evangelicals. Young voters are three times as likely as voters 65 and older to say they are not affiliated with a religious tradition; 19% of young voters say they have no religious affiliation, compared with just 6% of voters 65 and older.
Party Identification and Issues
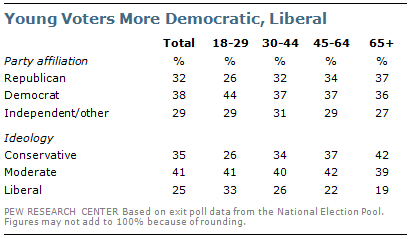
Young voters were not only more likely to back Obama, but they are far more likely than older voters to identify as Democrats than their older counterparts. A plurality of voters younger than 30 (44%) consider themselves Democrats while far fewer identify as Republicans (26%) or independents (30%). Young voters are as Democratic as they were in 2008 when 45% identified as Democrats (26% as
Republican and 29% as independent).
By comparison, Democrats had just a three-percentage point advantage in party identification among voters 30 and older. Among those voters, 37% identify as Democrats, 34% as Republicans and 25% as independents.
A third of young voters described their political views as liberal, while 41% said they were moderate and just 26% said they were conservative. Among voters 30 and older, 23% said their political views were liberal, 41% said their views were moderate and 37% described themselves as conservative.
Consistent with their strong vote for Obama and their Democratic Party affiliation, young voters also have more liberal views on a variety of issues. A majority (59%) said that the government should do
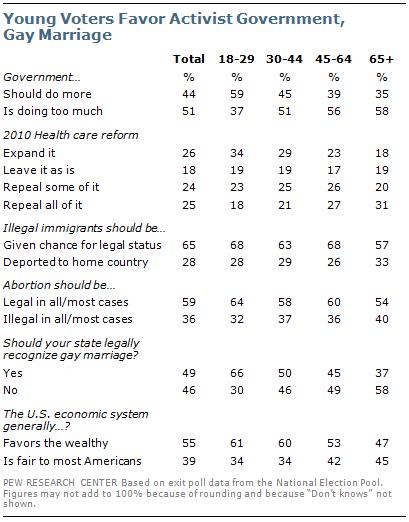
more to solve problems, while 37% said the government is doing too many things better left to businesses and individuals.
That is a somewhat narrower margin than in 2008 (69% vs. 27%), but they were still far more likely than older voters to say that the government should do more to solve problems.
Young voters also were far more approving of the 2010 health care law: 53% said it should be expanded (34%) or left as it is (19%). That compares with 42% of 30 and older who favored retaining the health care law or expanding it.
On social issues, 64% of voters younger than 30 said abortion should be legal in all or most cases, compared with 58% of voters 30 and older. And they are far more likely than older voters to support allowing gay marriage. Fully 66% of young voters favored their states legally recognizing gay marriage, compared with 45% of voters 30 and older (and just 37% of those 65 and older).


