Supporters of same-sex marriage won key victories in several states Tuesday, including the first instances in which laws allowing gays and lesbians to marry legally were approved by voters.
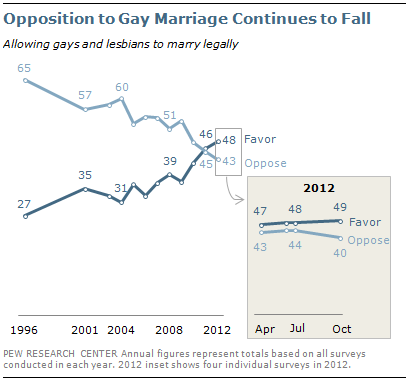
This comes at a time when support for same-sex marriage has been on the rise. Across four Pew Research Center surveys this year, 48% of Americans say they favor allowing gays and lesbians to marry legally, while 43% are opposed. Just four years ago, in the 2008 election cycle, 51% opposed making same-sex marriages legal and 39% supported it.
The steep recent trend has continued over the course of 2012. The most recent survey, conducted just two weeks before the election, found nearly half (49%) in favor of allowing gays and lesbians to marry legally, while opposition had fallen to an all-time low of 40%. (See survey topline). The tipping balance of American public opinion was confirmed in this week’s national election exit polling: 49% of voters said their state should legally recognize same-sex marriage; 46% said it should not.
The recent gains come after years of electoral setbacks for advocates of same-sex marriage. More than 30 states have prohibited gay marriage by popular vote over the past 15 years. Yet on Election Day 2012, ballot measures legalizing same sex marriage were approved in Maine, Maryland and Washington State. In Minnesota, which already prohibits same-sex marriage, voters rejected a bid to add that prohibition to the state’s constitution.
A look at different regions of the country finds wide disparities in attitudes about same-sex marriage. The states that approved measures this week are all in regions generally supportive of allowing gays and lesbians to marry legally. Other parts of the country are not as supportive.
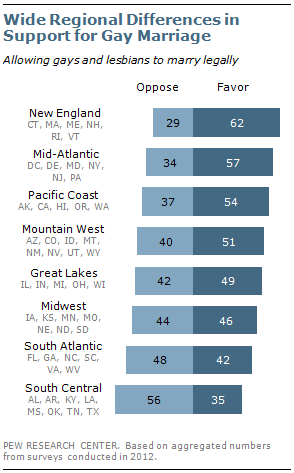
In New England, 62% favor same-sex marriage, while 29% oppose it. In the mid-Atlantic, 57% favor and 34% oppose allowing gay marriage. Opinions among those on the Pacific Coast are similar (54% favor, 37% oppose).
In the Midwest, which includes Minnesota, opinion is more evenly divided (46% favor, 44% oppose). Voters in Minnesota did not approve gay marriage, but did vote to keep the ban from becoming part of the state’s constitution.
People in the South express greater opposition. A majority (56%) in the central Southern states such as Alabama, Kentucky, Louisiana, Oklahoma and Texas oppose same-sex marriage, while about a third (35%) favors it. The divide is more narrow in the South Atlantic states such as Florida, Georgia, Virginia and the Carolinas (48% oppose, 42% favor). 1
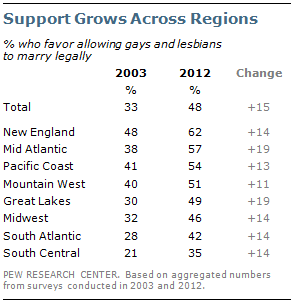
The trend toward increased support for gay marriage is evident across all regions. In each, the percentage that currently favors allowing gays and lesbians to marry legally is far higher than it was a decade ago.
Attitudes toward gay marriage in the South are comparable to where the country as a whole was a decade ago. In the states ranging from Kentucky to Texas, 35% now support same-sex marriage. That is comparable to the 33% that said this nationwide in 2003.
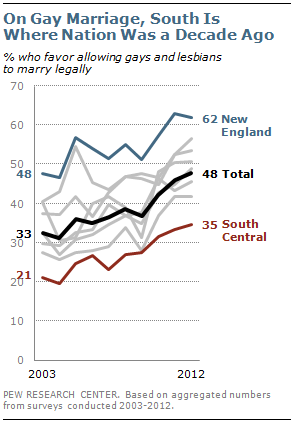
At the same time, the proportion nationwide that currently favors allowing gays and lesbians to marry legally matches the percentage that said this in New England a decade ago (both 48%).
Black Support for Gay Marriage Rising
One of the striking results in the 2012 exit polls was the support for legalizing gay marriage among black voters. In the national exit poll interviewing conducted by Edison Research on behalf of the NEP, black voters favored their state legally recognizing same-sex marriage by a 51% to 41% margin, while among whites, 47% favored and 49% opposed this idea.
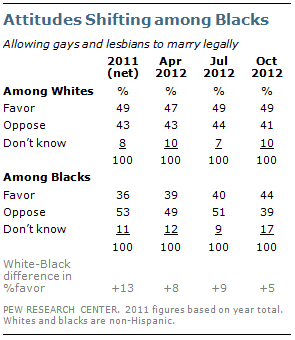
The latest polling by the Pew Research Center also finds some narrowing of long-standing racial differences in attitudes toward gay marriage. Consistently over the past decade, blacks have been far less supportive of legalizing gay marriage than whites. In 2011, for example, 49% of whites favored legalizing gay marriage, compared with just 36% of blacks.
But the latest survey conducted two weeks ago found blacks divided more evenly on this issue than in the past, with 44% in favor and 39% opposed to allowing gay marriage. Among whites, 49% favored and 41% opposed same-sex marriage.
The 2012 exit poll also found more Hispanic voters (59%) supporting gay marriage in their state than opposing it (32%). This also comports with the latest trends in Pew Research Center surveys of Hispanics nationwide. In the 2012 National Survey of Latinos conducted by the Pew Hispanic Center, 52% of Hispanics were in favor of allowing gays and lesbians to marry legally, while 34% were opposed. In both 2006 and 2009, opposition to gay marriage had exceeded support by wide margins among Hispanics.
For more on the demographics of support and opposition to gay marriage, see: Two-Thirds of Democrats Now Support Gay Marriage.


