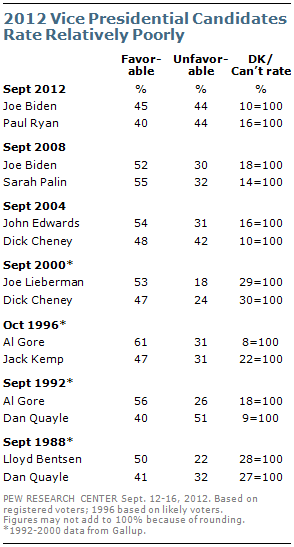
Voters offer a mixed view of both candidates’ vice-presidential nominees, which stands in contrast to the positive reception most recent running mates have received. In fact, across the

seven most recent presidential elections, only one was not viewed favorably on balance in September: Dan Quayle in 1992.
Joe Biden’s public image has suffered substantially over the past four years. In September of 2008, 52% held a favorable view of Biden and just 30% viewed him unfavorably. Today, that has slipped to 45% favorable, 44% unfavorable. A recent Pew Research Center/Washington Post poll found a substantial number of people offering negative one-word descriptions of Biden, including idiot, incompetent, clown, and goofy.
Paul Ryan’s ratings are similarly low: just 40% have a favorable view of him, while 44% express an unfavorable opinion. This lags behind ratings of Sarah Palin at this point in 2008, though views of Palin turned more negative as the election progressed. In September 2008, most voters viewed Palin favorably by a 55% to 32% margin. By mid-October, the balance had shifted to 44% favorable, 49% unfavorable. As with Biden, a recent Pew Research Center/Washington Post poll found as many people offering negative descriptions of Ryan, such as idiot, extreme and scary as offering positive words such as intelligent, energetic and smart.
Independent voters offer tepid ratings of both vice-presidential candidates. Joe Biden is viewed favorably by 42% of independent voters, while 50% view him unfavorably. Views of Paul Ryan are about the same: 40% favorable, 43% unfavorable. Both candidates are seen favorably by about three-quarters of their own party, but neither is popular with members of the opposing party.
Michelle Obama Viewed Favorably

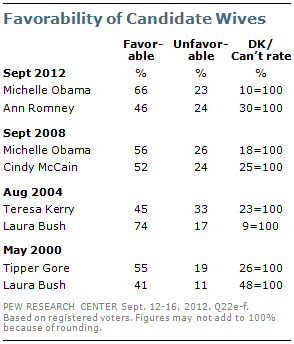
Overall, 66% of voters say they have a favorable view of first lady Michelle Obama, 23% hold an unfavorable view. Michelle Obama is viewed more positively today than she was four years ago; in September 2008, 56% held a favorable view of her and 26% an unfavorable view. While enjoying a strong positive image, Michelle Obama is seen slightly less favorably than Laura Bush in August 2004 (74% favorable, 17% unfavorable).
On balance, more voters view Ann Romney favorably (46%) than unfavorably (24%), though 30% are unable to rate her. Views of Ann Romney are comparable to opinions about Cindy McCain in September 2008, but on balance are more positive than those of Teresa Heinz Kerry in August 2004 (45% favorable, 33% unfavorable).
Bill Clinton’s Favorable Image

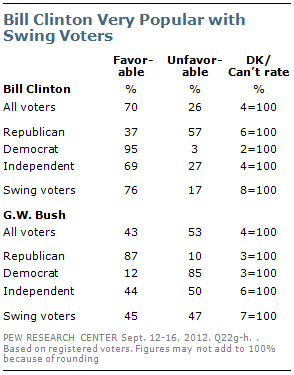
Fully seven-in-ten voters (70%) have a favorable view of Bill Clinton; just 26% hold an unfavorable view. Favorability ratings for Clinton have never been higher in Pew Research surveys dating back to 1992.
Among independent voters, 69% hold a favorable view of Clinton. Democrats are nearly unanimous in their positive view of the former president (95% favorable). Even among Republicans, 37% have a favorable view of Clinton. And Clinton’s potential value to the Obama campaign is clear: 76% of swing voters hold a favorable view of Clinton, while just 17% view him unfavorably.
George W. Bush is seen much less favorably by voters. Overall, more say they have an unfavorable (53%) than favorable (43%) view of the 43rd president. About nine-in-ten Republicans (87%) have a favorable view of Bush. But unlike Clinton, Bush draws mixed reactions from independents and swing voters.
Third Party Candidates

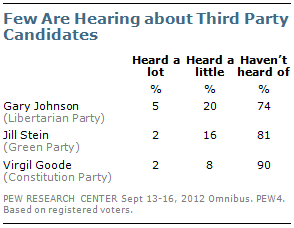
Very few voters are hearing much about third party candidates in this year’s election. A quarter of voters have heard of Gary Johnson, presidential candidate for the Libertarian Party, but only 5% have heard a lot about him. Fully 74% have not heard of him at all.
Even fewer have heard of the other third party candidates. Just 18% of voters have heard of Jill Stein, presidential candidate for the Green Party (and just 2% have heard a lot) while 81% have not heard of her. Just 9% of voters have heard of Virgil Goode, of the Constitution Party, while 90% have never heard of him.
And very few say they are voting for any of these third party candidates. In the current survey, just 2% of registered voters and 1% of likely voters volunteer their support for a candidate other than Obama or Romney. And even when these candidates are offered explicitly as choices to voters, Gallup found just 1% select each of them (with another 1% volunteering some other person’s name).
