The age differences in political attitudes and voting choices in the past three election cycles have been driven by three broad social and political trends. The first is the growing racial and ethnic diversity of the country, reflected in the rising percentage of non-whites among younger age cohorts. Non-whites have been far more supportive of the Democratic Party in the last several decades. Among members of the Silent generation today, 79% are non-Hispanic whites; among the Millennial generation, just 59% are non-Hispanic whites.
A second factor is the political environment experienced by successive generations as they have come of age politically. The relative popularity of the president and the two major political parties at the time an individual turns 18 has clear consequences for their voting preferences in subsequent elections.
A third factor is the broader societal changes that occur within a generation’s life cycle. These changes have a bigger impact on the political views of younger people, who are still in the process of forming opinions. Older people are more likely to reflect the values prevalent when they were growing up. The greater acceptance of homosexuality and interracial dating among young people than older ones today are examples of this.
Changing Demographics
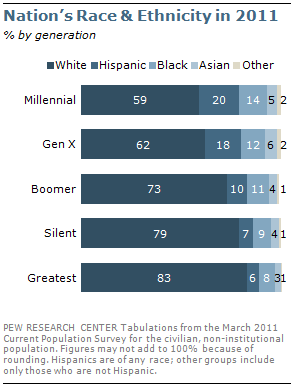
The contrasting race and ethnic compositions of the nation’s older and younger adults reflect overall change in the U.S., where non-Hispanic whites are a dwindling share of the population. The youngest adults today—Millennials, born after 1980—are far less likely to be non-Hispanic white than are the oldest Americans. While 59% of Millennials are non-Hispanic white, each earlier generation is more likely to be non-Hispanic white, culminating with an 83% share among the oldest Americans, the Greatest generation, born before 1928.
One-in-five Millennials is Hispanic (20%), compared with only 6% among Greatest generation Americans (now ages 84 and older) and 7% among Silent generation adults (ages 66 to 83). The same pattern of greater population share among younger generations is true for blacks, although the contrast between young and old is not as dramatic.
The generational pattern is more complex when it comes to immigration. The recent wave of immigration has contributed to the nation’s growing racial and ethnic diversity, but the youngest adults are not the most likely to be foreign-born. Generation X, ages 31 to 46, contains a higher percentage of immigrants (22%) than the Millennial generation (15%). Millennials, however, stand out as being more likely than all but the oldest Americans to be U.S.-born children of at least one immigrant pa
rent (12%). Among the Greatest generation, many of whose parents came to the United States during the nation’s immigration influx that began in the late 1800s, 17% are U.S.-born children of immigrants.
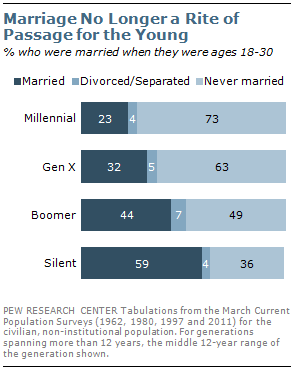
Millennials are far less likely to be married than earlier generations were when they were young. Currently, 23% of 18- to-30-year-olds are married. When Generation X was the same age in 1997 (ages 18 to 30), 32% were married. The equivalent share for Baby Boomers, in 1980, was 44%; for the Silent generation, in 1962, it was 59%. (For more on changes in marriage and the family, see Pew Social & Demographic Trends’ “The Decline of Marriage and Rise of New Families,” Nov. 18, 2010.)
Politics and Early Adulthood
Another major influence on the political character of successive generations is the political climate and events that people in each generation experienced as they reached adulthood and began to form their political identities.
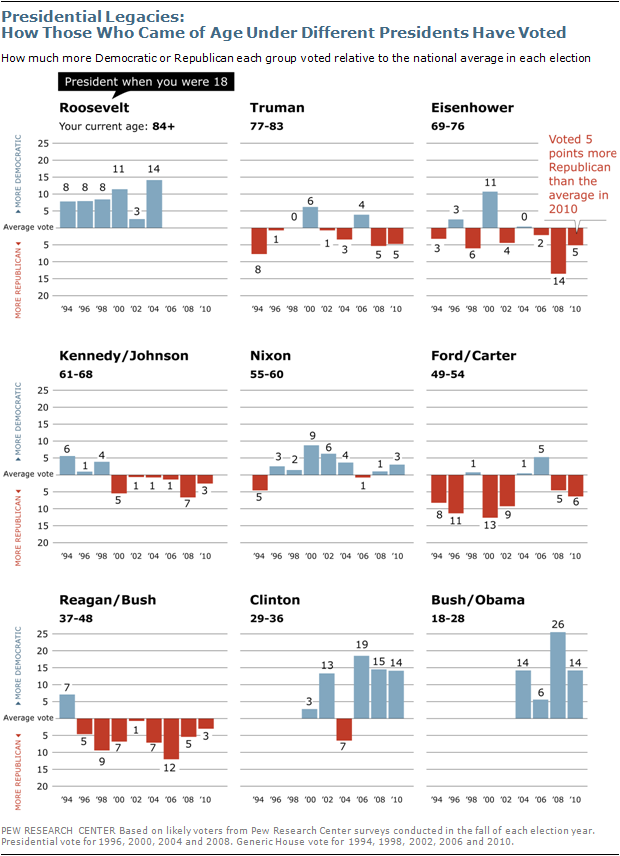
The graphic below shows the relative partisan voting patterns of individuals who reached the age of 18 during the presidential terms of the past 13 presidents. (In some cases, presidential terms are combined.) The label after the president’s names shows the current age of the individuals who turned 18 during those presidential terms. Each bar shows how much more Democratic or Republican that group voted, compared with the average vote for each election.
The clearest pattern is that younger voters who turned 18 during the presidencies of Clinton, Bush or Obama –the younger members of Gen X and the Millennial generation – have typically voted much more Democratic than the average. In contrast, voters who turned 18 during the Ford, Carter, Reagan and Bush Sr. presidencies –much of Generation X and younger Baby Boomers– have voted somewhat more Republican than the average.
The picture is less clear for older generations. Those who turned 18 during the Nixon administration – a segment of older Baby Boomers – have tended to be slightly more Democratic than average in their voting. Those who came of age during the Eisenhower, Kennedy and Johnson years – mostly members of the Silent generation and the very oldest of the Baby Boomers –have tended to be more Republican than the average, especially in 2008.
The Greatest generation is dwindling in numbers, but at least until recently their Democratic tendencies were still evident. Voters who turned 18 during the presidency of Franklin Roosevelt consistently voted more Democratic than average.
Recent Shifts in Voting, Party Affiliation
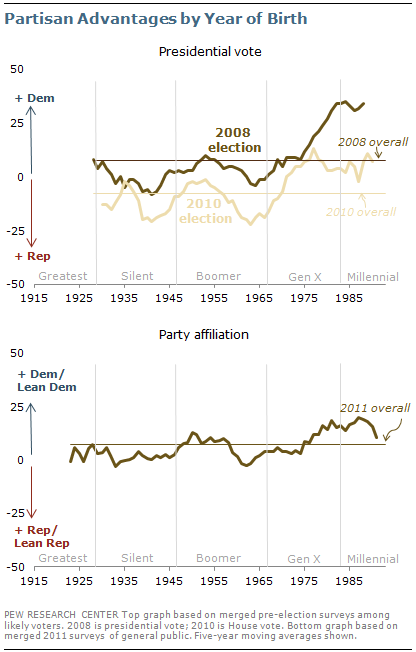
The mark of these early adult political experiences can be seen in recent party affiliation and voting tendencies of individuals according to their year of birth. This graph shows the partisan vote advantage in both 2008 and 2010 (percent Democratic minus percent Republican), as well as party affiliation in 2011.
In addition to showing the pattern according to year of birth, the conventional generational labels defining each birth cohort are also shown. For the vote in 2008 and 2010, the higher the line on the graph, the more Democratic the vote; conversely, the lower the line the more Republican the vote.
For party affiliation among the general public, the line shows the percent in 2011 identifying or leaning Democratic, minus the percent identifying or leaning Republican. The higher the line on the graph, the larger the Democratic advantage.
With the possible exception of the Millennial generation, the voting tendency and partisan leanings vary a great deal within generations, as well as across generations. Voters who came of age during the Eisenhower presidency – the younger half of the Silent generation – have been significantly more supportive of Republican candidates than average in recent elections. On the other hand, older Silents have voted less Republican, especially in 2008. In addition, in 2011 about equal numbers of Silents identify as Democrats and Republicans; for the adult population as a whole in 2011, Democratic affiliation surpasses Republican affiliation by about seven percentage points.
Older Baby Boomers, who came of age during Richard Nixon’s presidency, are more Democratic in their voting. But younger Boomers have been significantly more Republican than average in their party affiliation and voting preferences. The younger half of the Boomer generation came of age during a period of disillusionment with Democrat Jimmy Carter and during the beginning of the popular presidency of Republican Ronald Reagan. In this regard, younger Boomers have more in common with the older portion of Generation X, whose formative political experiences occurred during the later Reagan presidency and the early years of George H. W. Bush, than with older Boomers.
Generation X also is divided: Younger Gen Xers have more in common politically with the Millennial generation than with older Xers, reflecting a clear advantage for the Democratic Party. The percentage of this cohort identifying with or leaning to the Democratic Party or voting Democratic was significantly higher than among older cohorts and grew steadily into the presidency of George W. Bush.
This trend peaked with the election of Barack Obama, but has receded somewhat with the ongoing economic problems in the U.S. The voting preferences of those in the Millennial generation have been more Democratic than in older generations, but the gap was much smaller in 2010 than in 2008.
Generations, Social Issues and Religion
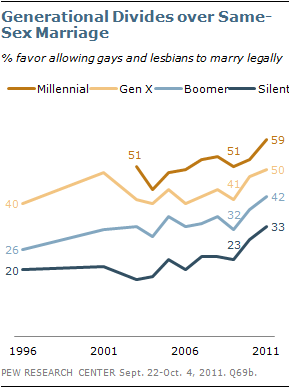
Generational differences in voting and party affiliation also are shaped by underlying values and attitudes that have been undergoing change in the past few decades. One of the clearest examples of generational change in social values is on views of homosexuality. Over the past 15 years, growing percentages in all generations favor gays and lesbians marrying legally.
However, Millennials and Xers remain more supportive of gay marriage than Boomers and Silents, whose early views on the issue were far more conservative than those of Millennials and Xers.
Nearly six-in-ten Millennials (59%) favor gay marriage compared with just 33% of Silents; this wide attitude gap persists even as Silents have become 13 points more likely to favor gay marriage over the past decade and a half.
Among middle-aged generations, more Gen Xers favor (50%) than oppose (42%) allowing gays and lesbians to m
arry legally. Boomers oppose gay marriage by a modest margin (48% to 42%); however, in 1996 Boomers opposed gay marriage by more than two-to-one (66% to 26%).
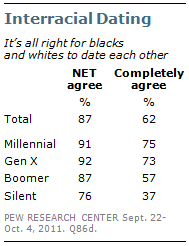
Attitudes about race also have changed, with younger generations leading the way. While large majorities of all generations now agree that it is all right for blacks and whites to date each other, the percent who completely agree with this statement is dramatically higher among Millennials and Xers than among Boomers and Silents. About three-quarters of Millennials (75%) and Xers (73%) completely agree with interracial dating, compared with far lower percentages of Boomers (57%) and Silents (37%).
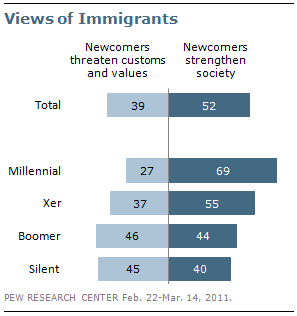
The greater acceptance of diversity among young people extends to views of immigrants and immigration. Overall, about half of the public (52%) says newcomers from other countries strengthen American society, while 39% say they threaten traditional American customs and values.
By a wide margin (69% to 27%), Millennials say newcomers strengthen American society, and most Xers (55%) share this view. Older generations are more divided: Boomers and Silents are about as likely to say newcomers threaten traditional American customs and values as to say they strengthen society.
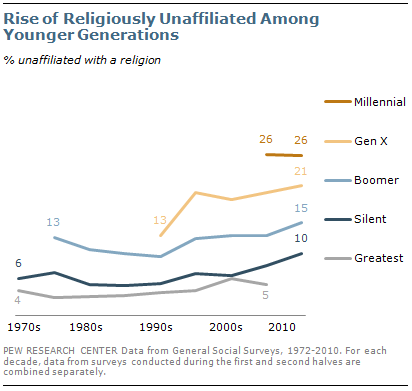
Younger generations also are significantly less likely than older ones to affiliate with a religious tradition. This pattern began in the 1970s when 13% of Baby Boomers were unaffiliated with any particular religion, according to the General Social Survey. That compared with just 6% among the Silent generation and 3% among the Greatest generation.
In the most recent General Social Survey, 26% of Millennial generation respondents said they were unaffiliated, as did 21% of Gen Xers. Among Baby Boomers, 15% were unaffiliated – not significantly different from when they were first measured in the 1970s. And just 10% of the Silent Generation said that they were unaffiliated.
Opinions about Government
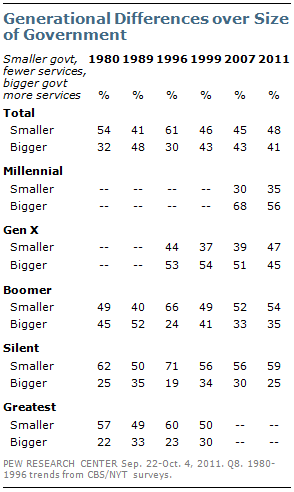
There also are deep generational divides in opinions about government. Overall, 48% of the public prefers a smaller government providing fewer services, while 41% would rather have a bigger government proving more services. This is little changed since 2009; in 2007 and 2008, opinion was more evenly divided.
Silents have long favored a smaller government and this continues to be the case today: Nearly six-in-ten (59%) Silents favor a smaller government providing fewer services, while just 25% favor a bigger government with more services.
Millennials, by contrast, prefer a bigger government providing more services (56%) over a smaller government providing fewer services (35%). Millennials’ preference for bigger government has declined since 2007 when about two-thirds (68%) favored a larger government.
Generation X is divided about evenly: 47% prefer smaller government, 45% bigger government. This marks a change from 2007 and earlier when a modest majority of Xers favored a bigger government.
More Boomers (54%) prefer smaller government than bigger government (35%), a point of view they have held since the 1990s. However, Boomers have not always felt this way: In 1989 more preferred a bigger government providing more services (52%) than a smaller government providing fewer services (40%).
Trust in Government Falls
Just 20% of Americans say they can trust the government in Washington to do what is right just about always or most of the time. Nearly eight-in-ten (79%) say they can trust the government only some of the time (72%) or volunteer that they can never trust the government (7%).
Overall trust in government has changed little over the past year, but is at one of its lowest levels in more than half a century. (For more, see People-Press’s “Distrust, Discontent, Anger and Partisan Rancor,” April 18, 2010.)
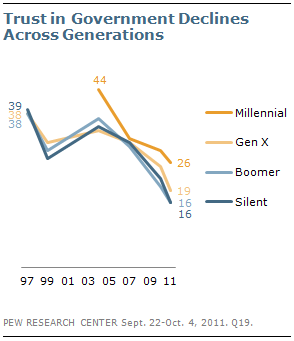
Trust in government has fallen among all generations in the past few years. Just 26% of Millennials say they can trust the government always or most of the time, down from 44% in 2004. There have been comparable declines among Gen Xers, Boomers and Silents. In all
three groups, no more than about one-in-five says they can trust in government always or most of the time.
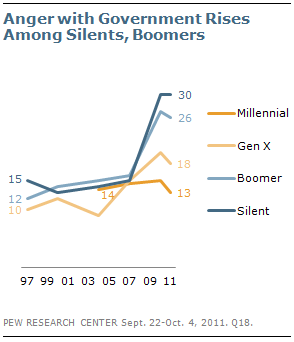
Most Americans also say they feel frustrated with the federal government and anger at the government has been increasing across generations, with the exception of Millennials.
In 2004, just 14% of Silents said they were angry with government – no different from the 14% of Millennials who said the same. Since then, the percentage of Silents who are angry at the government has more than doubled to 30%. But there has been virtually no increase in anger among Millennials (13% currently). Like Silents, more Boomers and Gen Xers say they are angry at the government than did so in 2004 (up 11 points and nine points, respectively).
Liberal and Conservative, by Generation
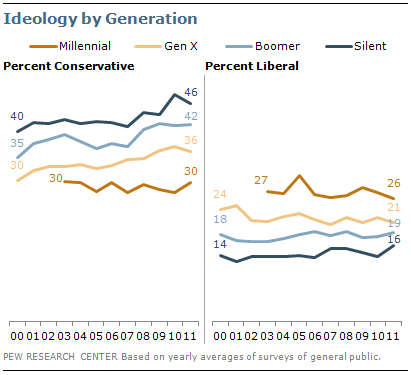
The generation gap in opinions across a number of issues is reflected in deep differences in how members of each generation describe their political views.
Fully 46% of Silents say they are conservative, while just 16% of Silents say their views are liberal. Since 2000, the percentage of Silents describing their political views as conservative has increased by six points, while the number of self-described liberals has remained largely unchanged.
Among Boomers and Gen Xers, there also are far more conservatives than liberals. And in both groups, the percentage of self-described conservatives has increased since 2000: from 35% to 42% among Boomers, and from 30% to 36% among Gen Xers.
Millennials are the only generation where about as many describe their views as liberal as conservative (26% vs. 30%). Self-reported ideology among Millennials has changed little in recent years.

