Overview
Barack Obama is a leading driver of voter preferences in possible 2012 matchups, among both his supporters and opponents. Currently, Obama is running a close race in hypothetical
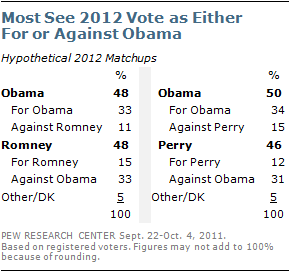
matchups against Mitt Romney and Rick Perry. Against both GOP candidates, most of Obama’s supporters view their vote as a vote for the president, while most of those who plan to vote for Romney or Perry see their vote as a vote against Obama.
Given a choice between Obama and Romney, 48% of registered voters say they would vote for Romney or lean toward Romney, while an identical percentage supports Obama or leans toward Obama. Most Obama supporters – 33% of all voters – say they consider their vote as a vote for the president, rather than as a vote against Romney. Conversely, far more Romney supporters say they view their vote as a vote against Obama rather than a vote for Romney. The pattern is similar in a possible Obama-Perry matchup.
The latest national survey by the Pew Research Center for the People & the Press, conducted Sept. 22-Oct. 4 among 2,410 adults, including 1,901 registered voters, finds that Romney holds a sizable advantage over Obama among political independents. Fully 54% of independent voters say that in an Obama-Romney matchup they would vote for Romney or lean toward Romney. Fewer independents (41%) say they
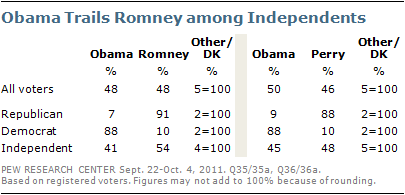
would vote for Obama. Democrats overwhelmingly support Obama while Republicans favor Romney by as large a margin. However, as has been the case in recent years, Democrats hold a wide lead in party affiliation: In the current survey, 35% of registered voters affiliate with the Democratic Party while 27% affiliate with the GOP and 34% are independents. As a result, despite Romney’s lead among independents, overall voter preferences are even (48% Romney vs. 48% Obama). (For a comprehensive breakdown of voter preferences in these matchups, see detailed tables.)
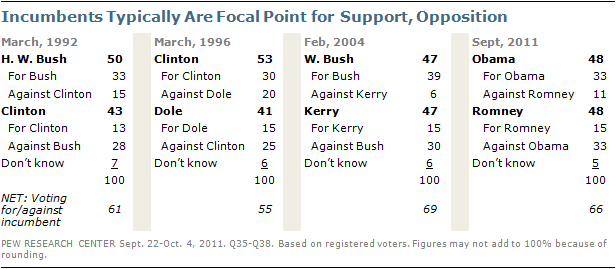
It is not unusual in the early stages of a presidential reelection campaign for the focus to be on the incumbent. In February 2004, most of George W. Bush’s supporters (39% of all voters) said they considered their vote as a vote for Bush, while most supporters of John Kerry (30% of all voters) said they viewed their vote as a vote against Bush. There was a similar pattern in early matchups involving Bill Clinton in his reelection bid in 1996 and George H. W. Bush in 1992.
Shifting GOP Primary Preferences
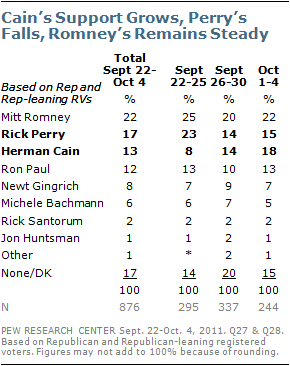
Romney continues to hold a slim lead for the Republican Party’s presidential nomination, with the backing of 22% of Republican and Republican-leaning registered voters. But three other candidates are in double digits – Perry at 17%, Herman Cain at 13%, and Ron Paul at 12%. Among the most attentive Republican voters – those who have given “a lot of thought” to the election – the current race is virtually a dead heat between Romney (23%), Perry (19%) and Cain (20%).
With interviewing conducted continually from Sept. 22 to Oct. 4, the survey provides a track of Perry’s declining support, and Cain’s growing support. In interviews conducted Sept. 22-25, Perry led Cain by a 23% to 8% margin. In later interviews conducted Oct. 1-4, Perry’s support had fallen eight points, while Cain’s support was up ten points.
Meanwhile, there were no significant shifts in support for any of the other announced candidates. Republican voters who agree with the Tea
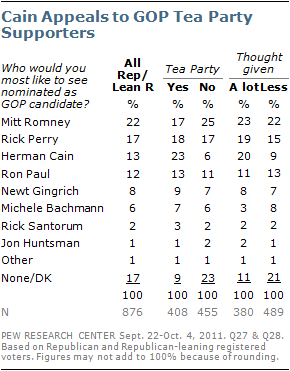
Party are particularly supportive of Cain’s candidacy – 23% back him compared with just 6% of Republicans who do not identify with the Tea Party. By contrast, Romney receives more backing from non-Tea Party Republicans (25%) than Tea Party Republicans (17%).
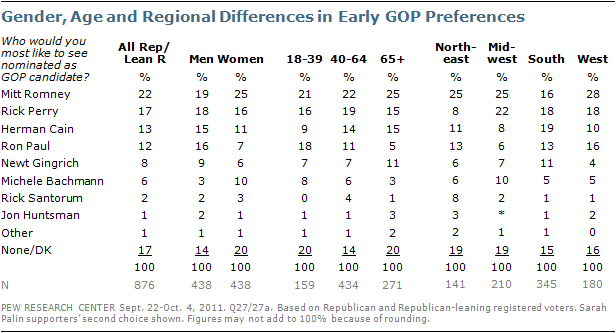
There are substantial regional differences in support levels for the GOP candidates. Perry retains significant support in the Midwest, South and West, but has very little backing from Republican and Republican-leaning voters in the Northeast, where Romney performs well. Cain has broader appeal in the South than in other regions.
Paul’s overall standing in the nomination contest is boosted by his broad appeal among younger GOP voters and men. He has the support of 18% of Republican and Republican-leaning voters under 40, compared with 11% among those 40 to 64 and just 5% among those age 65 and older. He also garners twice as much support among men (16%) as among women (7%).
2012 Electoral Landscape Less Favorable for Obama
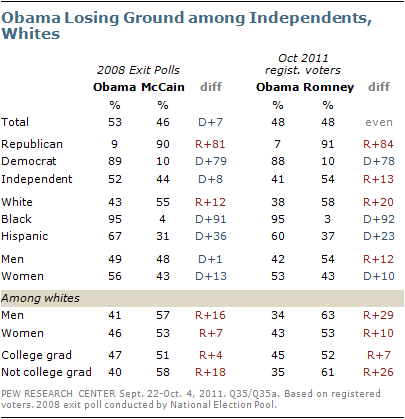
In 2008, Obama won a narrow majority of independents’ votes: 52% voted for him while 44% supported McCain, according to national exit polls conducted by the National Election Pool. But in a hypothetical race against Romney, independent voters favor the Republican by 13 points (54% to 41%).
Obama also is faring worse among white voters, particularly white men, than he did three years ago. Obama trailed McCain by 12 points among all white voters in 2008 (43%to 55%). But against Romney, Obama is losing the white vote by 20 points (38% to 58%).
Obama’s deficit among white men also has increased from 16 points in 2008 to 29 points in an early matchup with Romney. (For a comprehensive breakdown of voter preferences in the Obama-Romney and Obama-Perry matchups, see detailed tables.)
Obama Job Approval Steady
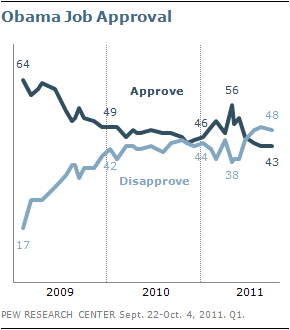
The survey finds that Obama’s job approval rating among the general public is little changed from August: 43% say they approve of the way Obama is handling his job as president, while 48% disapprove. In August, 43% approved and 49% disapproved. Obama’s current job rating is down from May, when 52% approved of the way he was handling his job.
As was the case in August, significantly more strongly disapprove of Obama’s job performance (34%) than strongly approve (26%). Earlier this year, the balance of strong approval to strong disapproval was about even (in March, 32% strong approval vs. 29% strong disapproval). (For a breakdown of Obama job approval ratings, see detailed tables.)


