Among registered voters, 34% call themselves Democrats, and 28% Republicans. With virtually all partisans voting for their party’s candidates, and independent registered voters divided, the overall race is about even (47% of registered voters favor Democrats, while 44% favor Republicans).

But when the sample is narrowed to likely voters, two things happen. First, high engagement and enthusiasm levels among Republicans close the party gap; among likely voters, there are an equal number of Republicans (32%) and Democrats (33%). Second, the GOP enthusiasm advantage carries over to independents as well; independents who are planning to vote Republican are far more engaged than those who favor the Democrats. With Democratic and Republican likely voters largely cancelling each other out, the 13-point GOP advantage (49% to 36%) among likely independent voters is the pivotal factor behind the Republican Party’s overall seven-point lead among all likely voters at this point in the campaign.
The improvement of the GOP’s position among independents when the focus is on likely voters – as opposed to all registered voters – occurs across virtually all demographic subgroups. But the difference is particularly notable among younger independents, those with lower incomes, and among women. For these groups,
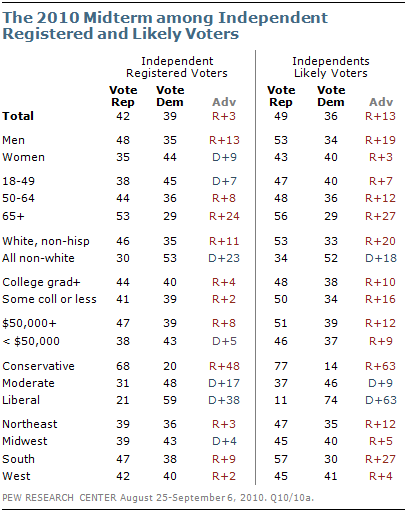
Democrats hold a modest advantage over Republicans among registered voters; but when the analysis is narrowed to those most likely to vote, the balance of congressional vote preference reverses. For example, independents under 50 favor the Democratic candidate by 45% to 38% among registered voters, but when based on likely voters, the GOP holds a 47%-40% edge.
Among independent likely voters, the Republican Party fares particularly well among whites (53%-33%), those over age 65 (56%-29%) and those living in the South (57%-30%). The Democratic Party holds a lead only among nonwhite independents (34%-52%, there are too few black, Hispanic and other nonwhite independents to analyze separately), and among self-described liberals.
Regionally, Democrats run about even with Republicans among likely voters in the Midwest and West, but trail by a wide margin in the South and narrowly in the Northeast.
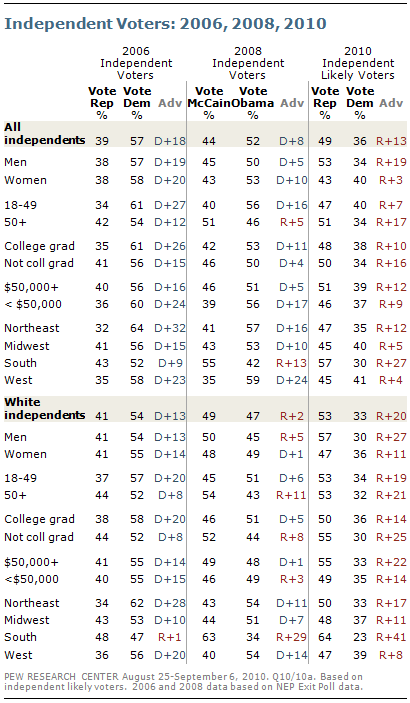
There are also signs of a much more substantial gender gap among independents this year than was the case in 2006 or 2008. In both 2006 and 2008 there was virtually no gender gap among independent voters (the overall gender gap in those years reflected the fact that women were more likely than men to identify as Democrats). This year, by contrast, independent men favor the Republican Party by a 53% to 34% margin, while independent women are divided about evenly in their vote preference (43% Republican, 40% Democratic).
Currently, independent voters younger than 50 are divided: 47% plan to vote Republican while 40% say they will vote Democratic. In 2008, Obama carried this age group by 16 points (56% to 40%). And those 50 and older, who backed McCain over Obama by a narrow margin (51% to 46%), are voting Republican by an even wider margin (51% to 34%).
Overall, white, non-Hispanic, independent likely voters – who split almost evenly in the Obama/McCain race two years ago, favor the Republicans in 2010 by a 20-point margin (53% to 33%). Independent white men, those with less education, and those living in the South are the most supportive of Republican candidates this year.
Obama Evaluations Shape Independent Vote
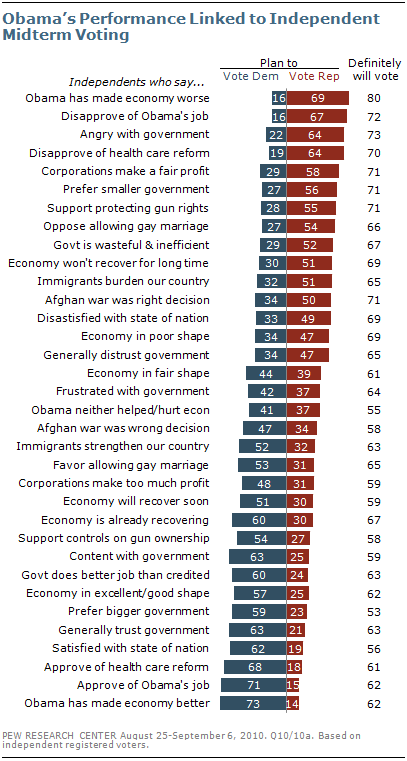
While demographic characteristics, government evaluations and policy preferences are all linked to how independents intend to vote this fall, evaluations of the president’s performance have the strongest relationship to independent voting patterns. Fully 71% of independents who approve of Obama plan to vote Democratic, while 67% of those who disapprove of Obama plan to vote Republican. Evaluations of whether Obama’s policies have helped or hurt the economy have about the same impact on independent voting, as does support or opposition to health care legislation.
It is not unusual, however, for presidential evaluations to have this kind of link to midterm voting among independents. Typically, around two-thirds of independents who disapprove of a president’s job performance going into a midterm support candidates of the opposing party, while most who approve of the president back candidates who are of the same party.
But the link between job approval and independent midterm voting works to the benefit of the GOP for two reasons. First, more independents currently disapprove (50%) than approve (39%) of Obama’s job performance. Second, those who disapprove are far more enthusiastic about voting than those who approve. Among independents who disapprove of Obama’s job performance, 72% say they will definitely vote and 59% have already given a lot of thought to the elections. By comparison, 62% of independents who approve of Obama say they will definitely vote, and 40% have given a lot of thought to the election.
Voting “For” or “Against” the President

While the link between presidential job approval and independent midterm voting has a long history, half (50%) of independents say that Barack Obama is not a factor in their congressional vote this fall. Among those who say he is a factor, however, more say their vote is a vote against Obama than for him by nearly two-to-one (29% vs. 16%).
In 2006, roughly the same percentage of independent voters (35%) said they viewed their vote as a vote against Bush, while just 10% saw their ballot as a vote for Bush.
In prior midterms in 2002, 1998 and 1994, the president was less of a factor in independents’ voting decisions; more than 60% in all three elections said the president was not a factor. In 1994, more independents regarded their vote as against Bill Clinton than a vote for him (by 19% to 8%).

