
Broad public frustration with government and politics is likely to play a major role in the midterm congressional elections this fall, and all signs suggest it benefits the Republican Party. In particular, seven months before the midterm elections, anti-incumbent sentiment has reached record levels, and anti-government sentiment is energizing many Republican-inclined voters.
Voters are evenly divided in their candidate preferences for this fall; 44% favor the candidates of each party, with 12% undecided. This is comparable to the voters’ preferences in July 1994, when Republicans went on to win a majority of House seats. However, despite growing frustration with politics over the past year, voter preferences have not tilted further in the GOP’s direction since August of last year. (For more detailed breakdowns of Congressional vote preferences, see table on pg. 93)

Record Anti-Incumbent Sentiment
Just 43% of voters now say they would like to see their member of Congress reelected in the fall. This is a record low point in the 16 years since Pew Research first began asking this question, and a significant drop from the already-low numbers seen last month.
Anti-incumbent sentiment is relatively widespread, with just 41% of Republicans, 54% of Democrats and 36% of independents saying they would like to see their representative reelected. This marks the lowest percentage of support for incumbents among both Republicans and independents over the last five midterm election cycles. And the 54% of Democrats expressing support for their incumbent nearly matches the Democrats’ anti-incumbent mood in 2006, when Republicans controlled Congress.
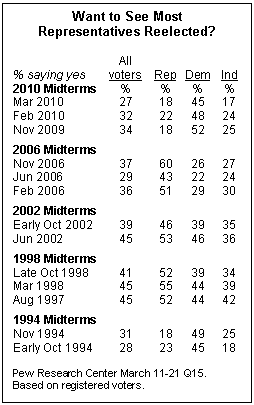
Similarly, opinions about whether most members of Congress should be reelected now match the previous lows. Today, just 27% of voters say they would like to see most members reelected; this is down from earlier in the year, and is at about the same level as in the fall of 1994, just prior to the ouster of many incumbent representatives.
Views of Government and the 2010 Vote
Both voting preferences and enthusiasm are strongly related to dissatisfaction with government. This is particularly true among independents; overall, independents slightly favor the Republican candidate, by a 41% to 34% margin. But among independents who score high on an index of dissatisfaction with government, Republicans enjoy a five-to-one (66% to 13%) advantage while Democrats hold a two-to-one advantage (49% vs. 24%) among the remainder of independent voters.
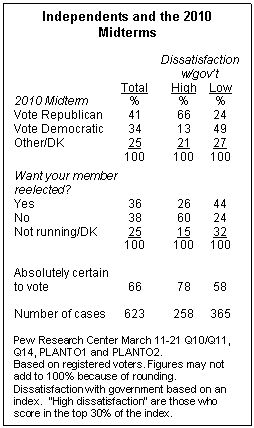
Dissatisfied independents also are more anti-incumbent; six-in-ten (60%) say they do not want to see their representative reelected in the fall, compared with 44% of more satisfied independents.
And anti-government sentiment is also linked to enthusiasm about voting. About three-quarters (78%) of independents who are dissatisfied with government say they are absolutely certain they will vote, compared with 58% of more satisfied independent voters.
The link between dissatisfaction and voting among independents remains strong even when party leaning is taken into account. Nearly four-in-ten (37%) independents say they lean Republican in their party identification, representing 13% of voters overall. Within this group, those who are highly dissatisfied with government are more likely than their more satisfied counterparts to support the GOP’s candidate in their district, and 85% say they are certain to vote, compared with 62% of more satisfied Republican-leaning voters.
And the potential mobilizing effect of anti-government sentiment is seen among self-identified Republicans as well – 83% of highly dissatisfied Republican voters say they are absolutely certain they will vote, compared with 67% of those who are more satisfied. By contrast, within Democrats and Democratic leaners, there is no significant difference in engagement by level of satisfaction with the federal government.
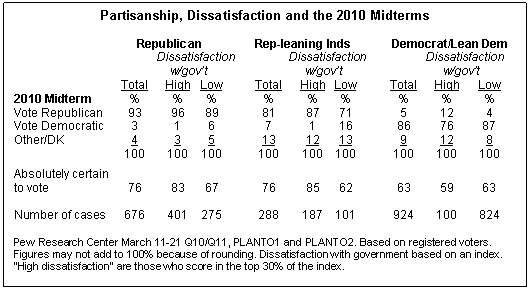
In short, the current enthusiasm gap between Democratic and Republican voters this fall is strongly associated with anti-government sentiment. Overall, 76% of Republican and Republican-leaning voters say they are certain they will vote, compared with 63% of Democratic and Democratic-leaning voters. Relatively satisfied Republican voters are no more committed to voting than are Democrats – it is the highly dissatisfied Republicans and independents that are driving this difference.
Dissatisfaction and Health Care Reform
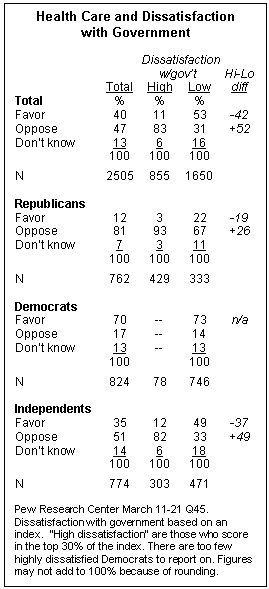
Public views on health care reform were highly partisan from the start, but views of government also played a substantial role. In a December 2009 Pew Research Center poll, 84% of people opposed to health care reform said “too much government involvement” was a major reason for their opposition – more than any other concern listed.
In the March survey – conducted during the final debate over the bill in Congress – 40% of Americans favored the legislation, while 47% opposed it. Among the segment of the public most dissatisfied with government in general, 83% opposed the bill, while a slim majority (53%) of more satisfied Americans favored it.
Highly dissatisfied Republicans nearly universally opposed the legislation (93% oppose, 3% favor), while opposition was less overwhelming among more satisfied Republicans (67% oppose, 22% favor).
Among independents, the gap in opinion between the satisfied and the dissatisfied is even wider. Highly dissatisfied independents opposed the legislation by an 82% to 12% margin, while more satisfied independents favored the legislation than opposed it (49% favor, 33% oppose). Seven-in-ten Democrats backed the legislation in the weeks before the bill passed, and there were too few highly dissatisfied Democrats to analyze.
Dissatisfaction and Financial Regulation

Americans back stricter regulation of major financial institutions by nearly two-to-one (61% good idea, 31% bad idea). But the majority of those who are highly dissatisfied with the federal government say increased regulation would be a bad idea (54% bad idea, 40% good idea).
Overall, most Republicans oppose stricter financial regulations (39% good idea, 54% bad idea), but there are significant differences by level of satisfaction with the federal government. On balance, more satisfied Republicans favor financial regulation than oppose it (50% good idea, 42% bad idea), while dissatisfied Republicans oppose it by a greater than two-to-one margin (29% good idea, 66% bad idea).
Most independents support greater financial regulation. About six-in-ten (63%) say it is a good idea to more strictly regulate the way major financial compaies do business, while three-in-ten (30%) say this is a bad idea. But, as with Republicans, there is a significant split in opinion by level of satisfaction with government. Dissatisfied independents are more evenly divided about increased financial regulation (50% good idea, 45% bad idea); by contrast, more satisfied independents favor increased regulation by a greater than three-to-one margin (71% good idea, 21% bad idea). Democrats overwhelmingly favor stricter regulation (78%), and there are too few highly dissatisfied Democrats to analyze the effect of anti-government sentiment on their views.
About the Index of Satisfaction with Government
Throughout this chapter, we compare the views of people who are more and less dissatisfied with government based on an index of questions from the March 11-21 2010 survey:
• Federal government or Congress effect on the country (Q18aF1 & Q18hF2) • Content, frustrated or angry with the federal government (Q20) • Trust in the federal government (Q21) • Maintain or cut back federal government programs (Q23) • Criticism of the federal government justified or not (Q25) • Federal government needs major reform, some reform, or no reform (Q26) • Federal government’s effect on your own day-to-day life (Q27a/Q28a) • Congressional job performance (Q52a) • Obama administration job performance (Q52b) • Federal agency job performance (The average rating given to nine federal agenciesor instituions Q52d, Q52f, Q52g, Q52i, Q52l, Q52m, Q52n, Q52p, Q52r) •Perceived threat of the federal government to personal rights and freedoms (Q73)
Those we define as highly dissatisfied are Americans who score in the top 30% on this index. Republicans and independents who lean to the Republican party are the most likely to pass this threshold: 51% of Republicans and 59% of Republican leaners are considered to be highly dissatisfied on this index. By comparison, relatively few Democrats (9%) or independents who lean to the Democratic Party (15%) score as highly dissatisfied with the federal government.

To see how your views of the federal government compare with the respondents in this survey, you can answer the questions on our website (http://pewresearch.org/satisfaction/) and see your score.

