Summary of Findings

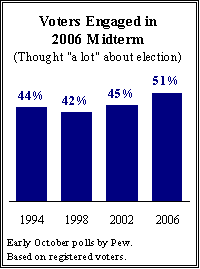
Turnout in the 2006 midterm election may well be higher than normal, given the level of interest expressed by voters. Today, 51% of voters say they have given a lot of thought to this November’s election, up from 45% at this point in 2002 and 42% in early October of 1998. Even in 1994 ­ a recent high in midterm election turnout ­ just 44% of voters had thought a lot about the election in early October.

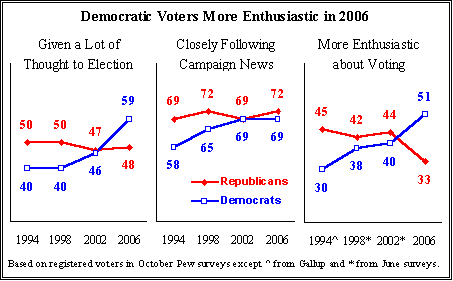
The difference this year is due to record-high levels of Democratic enthusiasm about the election. Currently, 59% of Democratic voters say they have given a lot of thought to this election, up from 46% at this point in the 2002 election. Republicans, by comparison, are no more or less engaged this year than four years ago (48% now, 47% in 2002). Democrats are also far more excited about voting this year, with 51% saying they are more enthusiastic about voting than usual, up from 40% in 2002. Just a third of Republicans say they are more enthusiastic about voting than usual, down from 44% four years ago.
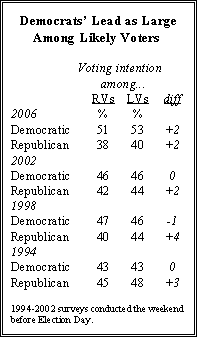
Notably, the ongoing scandal involving former Rep. Mark Foley has not had much of an impact on either the engagement or enthusiasm of Democratic and Republican voters. The Democratic advantages on both dimensions were about the same after Foley resigned as before the congressman stepped down.

The comparison between the current campaign and the 1994 midterm election, when Republicans won the majority of House votes and picked up more than 50 seats, is particularly telling. In early October 1994, 50% of Republican voters had already given a lot of thought to the election, compared with 40% of Democratic voters. Today, this margin is nearly reversed, as 59% of Democrats have given a lot of thought to the 2006 midterm, compared with 48% of Republicans.

These indications of Democratic engagement suggest that the turnout advantage the GOP has enjoyed in recent elections may not hold this November. Current estimates suggest that Democratic enthusiasm may compensate for some of the demographic factors that often lead to lower Election Day turnout among Democrats.
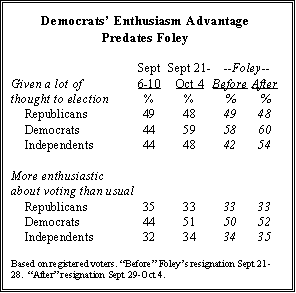
In Pew’s latest survey, conducted in collaboration with the Associated Press Sept. 21-Oct 4 among 1,503 registered voters, the Democrats hold a 51% to 38% edge among registered voters ­ largely unchanged from surveys conducted over the past year. When the sample is narrowed to likely voters, the Democratic advantage remains at 13 points: 53% of likely voters saying the plan to vote for the Democratic candidate in their district, and 40% for the Republican candidate.

The current survey was in the field for eight days prior to Foley’s resignation on Sept. 29, and six days after his resignation. When these two periods are compared there are no substantial differences that suggest the event itself was a turning point.
Before Foley’s resignation, 58% of Democratic voters said they had given a lot of thought to the election, and 50% said they were more enthusiastic about voting than in previous elections. Those numbers were largely unchanged in the days after Foley stepped down. And Republican enthusiasm about voting, while continuing to be lower than among Democrats, did not slip in the wake of the Foley revelations (33% before Foley resigned, 33% after).

Democrats Angry, But Optimistic About Prospects

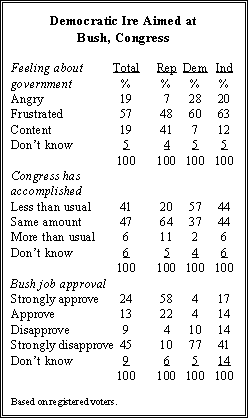
Two clear factors underlie Democratic engagement this year ­ anger about the current political leadership and optimism about the party’s chances. Across every question about politics and government, Democrats express high levels of dissatisfaction, especially with President Bush. Fully 77% of Democratic voters very strongly disapprove of the job Bush is doing as president, and nearly two-thirds (63%) say they consider their vote this fall as a vote against Bush.

Democratic frustration goes beyond just the President. Most Democratic voters (57%) say this Congress has accomplished less than other recent Congresses, and the vast majority expressing this opinion say Republican leaders are to blame (88%). And when asked whether they are “angry,” “frustrated,” or “basically content” with government these days, 28% of Democratic voters say they are angry. This is up from 20% in 2004 and just 11% in 2000. More important, in 2000 there was no partisan divide in feelings of anger toward government, while today four times as many Democrats as Republicans say they are angry at government.
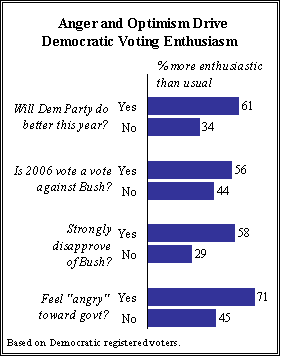
This anger plays a large role in the high level of enthusiasm among Democratic voters. Fully 71% of Democratic voters who describe themselves as “angry” at government say they are more enthusiastic about voting this year, compared with 45% of those who are “frustrated” or “basically content” with government. Similarly, Democrats who register strong disapproval of the president are far more likely to be eager to vote than those with less strong views (58% vs. 29% enthusiastic). And 56% of Democrats who say their congressional vote is a vote against the president express high enthusiasm about 2006, compared with just 44% who say Bush is not a factor in their vote.

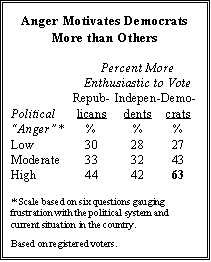
Overall, anger is a much stronger factor in turnout for Democrats than it is for Republicans and independents. When six questions measuring various types of dissatisfaction and frustration with government are combined into an index, voters can be scored as to how angry they are relative to others. Fully 63% of Democrats who score high on this index say they are more motivated to vote this year than usual ­ this compares with just 44% of “angry” Republicans and 42% of “angry” independents
Another factor driving up Democratic enthusiasm is optimism about the party’s prospects in this midterm. Nearly two-thirds of Democrats (65%) say they think the party will do better in 2006 than it has in other recent elections ­ 28% say they will do about as well as they have, and just 2% see the party doing worse than usual this year. And the more optimistic Democrats are, the more engaged they are ­ 61% of those who think the party will do better are more enthusiastic about voting than usual, compared with just 37% of those who do not predict Democratic gains this fall. Republicans’ expectations are more modest for the upcoming elections: More than half of Republican voters (57%) say their party will do about the same as in recent elections; 22% think the party will fare worse; and just 15% of Republicans think the GOP will do better than in recent elections.

Ballot Measures’ Modest Impact

So far, voter awareness of ballot issues in their state is somewhat lower this year than in 2004. Just 39% of voters in states with one or more statewide referenda, initiatives or constitutional amendments on the ballot are aware that this is the case. In late October 2004, 56% of voters in states with ballot measures were aware that these measures were before the voters. The 2004 survey, however, was conducted closer to Election Day than the current survey, and these figures may increase in the coming weeks.

One thing that seems clear is that some of the key issues that were thought to have the potential to mobilize turnout have not yet registered in voters’ minds. Just 13% of voters in the eight states where gay marriage initiatives or amendments are on the ballot are aware that they will be able to vote on this issue ­ down from 26% in states with
similar ballot measures two years ago. And only 3% of voters in the six states with minimum wage ballot measures are aware that this will be on the ballot.

Confidence in Vote Counts

Most voters (58%) say they are very confident that their votes will be accurately counted in the upcoming election. Another 29% say they are somewhat confident their votes will be counted correctly. Only about one-in-ten voters (12%) say they are not too confident or not at all confident their votes will accurately counted.

Attitudes on this issue have not changed much since the 2004 presidential campaign. In mid-October of 2004, 62% of voters expressed a high level of confidence their votes would be accurately counted, while 26% said they were somewhat confident their vote would be accurately counted.

There continues to be a large partisan gap in confidence that votes will be counted correctly in November; 79% of Republicans express a high degree of confidence their votes will be accurately counted, compared with 45% of Democrats.

Notably, African American voters express much more skepticism their votes will be accurately counted than they did in the fall of 2004. Just 30% say they are very confident their votes will be accurately counted, down from 47% two years ago. The percentage of black voters who express little or no confidence in vote-counting procedures has approximately doubled ­ from 15% to 29%. More than three times as many blacks as whites now say they have little or no confidence their vote will be accurately tallied (29% vs. 8%).

New Voting Technology

About two-thirds of voters (68%) say they have heard that states are using new technology at polling places, which changes the way votes are cast and counted. Three-in-ten say it makes things better, compared with 11% who say it makes things worse. However, a relatively large minority of voters say it does not make much difference, or offer no opinion (32% combined).

There is somewhat less awareness of the new technology than there was two years ago, during the presidential campaign. However, the balance of opinion about the new technology is a bit more positive than it was two years ago.

Republicans are more bullish about the changes in the way votes are cast and counted than are either Democrats or independents. Roughly four-in-ten Republican voters (41%) say it will make things better; that compares with 28% of independent voters and 25% of Democratic voters.

Vote by Mail?

The public decisively rejects the idea of scrapping the current voting system with voting by mail, although most Americans are open to giving people the option of voting by mail. Nearly two-thirds (64%) say they oppose replacing voting booths with voting by mail, and 38% say they strongly oppose such a change. However, 55% favor allowing people to vote by mail prior to the election, instead of in a voting booth on Election Day.

Roughly four-in-ten people in the West (41%) support replacing traditional methods of casting ballots with voting by mail. That compares with just a quarter of residents of the South and Midwest, and 21% of those in the East. Oregon is the only state in the U.S. where all ballots are cast by mail.

There is fairly broad support for allowing ­ but not requiring ­ people to vote through the mail before the election. However, roughly half of residents of the Northeast oppose (49%) the option of early voting by mail, while just 42% support this option. By contrast, half of those in the South, and large majorities in the West (67%) and Midwest (61%) favor allowing people to vote by mail before the election instead of in a voting booth on Election Day.

One-in-Four Seniors Plan to Vote Early

The vast majority of registered voters (77%) say they will probably vote at their polling place on Election Day, but 14% plan to vote by mail or absentee ballot before Nov. 7. Early voting is widespread among older Americans and in the West. Just under a quarter (24%) of voters age 65 and older say they intend to cast their midterm vote before election day this year. By comparison, just 5% of registered voters under age 30 intend to vote early.

About a third of voters in the West (34%) say they will cast their vote before Election Day, while 56% intend to vote at their polling place on Nov. 7. Early voting is far less common in other parts of the country, with just 6% of voters in the Northeast, 9% in the South, and 12% in the Midwest saying they plan to vote early.

Part of this regional difference is due to the fact that every state in the West allows no-excuse early voting, and Oregon requires all voters to cast their ballots by mail. In other regions, many states require voters to have a legitimate excuse to cast their ballot prior to Election Day. However, even when access to early voting is readily available, it is far less popular in the East, Midwest and South than it is in the West. Setting aside Oregon, 32% of Westerners say they plan to vote before Election Day. But in states outside the West that allow no-excuse early voting either by mail or in-person, just 12% say they plan to take advantage of this opportunity.

Campaign Contacts

About half of voters (49%) say they have been contacted by a candidate or a political group in the past few months, encouraging them to vote in a particular way. Most of these voters ­ 38% overall ­ say they have been contacted over the phone, compared with 15% who report being contacted by email, and 14% who say they were contacted in person.

Somewhat more Republican voters (55%) than Democratic (50%) or independent voters (45%) say they have been contacted by a candidate or political group, either by phone, email, or in person. In addition, highly-educated, high-income voters are much more likely than others to say they have been contacted by a campaign or political group. Nearly half of voters with college educations (49%) say they been contacted by phone, compared with just 31% of voters with high school educations.

For the most part, Republican voters say they have been contacted by GOP candidates, while Democratic voters say they have been contacted by candidates from their party. Somewhat more independent voters say they have been contacted by Democratic than Republican candidates (13% vs. 8%), while 11% say they have contacted by candidates from both parties.

Most Have Seen or Heard Political Ads

With still about a month to go until Election Day, 75% of Americans say they have seen or heard commercials for candidates running for office. Nearly four-in-ten (37%) say they have seen or heard a lot of advertisements, 18% some, and 20% have seen or heard just a few campaign ads.

There are only modest regional variations in the percentages who report seeing or hearing political commercials: 80% in the Midwest, 78% in the Northeast, 73% in the South and 71% in the West say they have seen or heard such ads. However, nearly half of residents of the Midwest (48%) say they have seen or heard a lot of campaign commercials, much more than in other regions (36% Northeast, 33% South, 30% West).