Samples Mirror Public Profile

The profile of people interviewed in the standard survey conducted by Pew mirrors most demographic characteristics of the American public. Despite the growing difficulties in obtaining a high rate of response, well-designed telephone polls reach a representative cross-section of the public in terms of race, age, marital status, and even key economic characteristics such as home ownership, receipt of food stamps, and health insurance status.
To assess whether respondents to a typical survey are representative of the adult population, the demographic composition of the survey samples are compared with national parameters established in surveys that obtain response rates of 90% or more, such as the U.S. Census and the National Health Interview Survey.
Polls do not perfectly mirror all of the characteristics of the adult population. They often include too many women and too few minorities and people with low levels of education. But the demographic composition of the standard survey conducted June 4-8 was close to the U.S. Census parameters on most indicators. On the important characteristic of race, blacks made up 10% of the standard sample (compared with 12% of the public). But the survey included too few Hispanic respondents 7% compared with the U.S. Census estimate of 12%.
The standard sample obtained slightly fewer people under age 35 than is true of the population, but the difference was relatively small (28% in the sample, 31% in the population). The biggest mismatch between the sample and the population pertained to educational levels: 16% of U.S. adults have not completed high school, but only 8% of survey respondents had not finished high school. Similarly, one-quarter of the public (25%) has at least a four-year college degree, but 34% in the sample said they have a college degree.
Yet the rigorous survey, despite its higher response rate, was not always closer to population parameters than the standard survey. It did do somewhat better in terms of race and ethnicity; the proportions of African Americans (11%) and Hispanics (11%) were very close to the population figures for each.1
And the rigorous sample was somewhat more reflective of the general public’s education as well as current levels of cigarette smoking. But it was no closer to the population in terms of the income and age composition of the sample and was slightly less accurate than the standard survey in its estimate of food stamp utilization and health insurance status.
In general, locating and interviewing more people who were hard to reach did not always improve the demographic representativeness of the sample. Compared with the population as a whole, the hardest-to-reach were less apt to own their own home and less likely to be white, but they were about the same in terms of age, education, and other dimensions.
Most surveys including those conducted by the Pew Research Center attempt to correct for demographic biases through the use of statistical weighting, in which certain characteristics of the sample (e.g., education, race) are compared with known parameters of the population and then adjusted to match them. The result is typically to give slightly more weight to African-American and Hispanic respondents, the less educated, males, and the young. Most of the comparisons in this report are based on weighted data.
Political Engagement and Voting
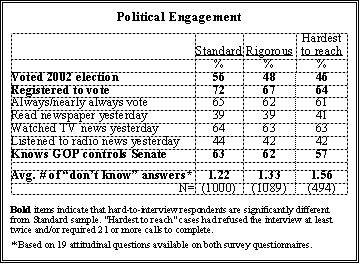
One consistent pattern that the survey experiment revealed is that people who are reluctant to be interviewed are somewhat less interested and engaged in politics than those who readily consent to an interview. Fewer people in the rigorous survey particularly among the hardest to reach said they were registered to vote or reported voting in the 2002 congressional election.
A majority in the standard sample (56%) say they voted in 2002, compared with 48% in the rigorous sample and 46% among the hardest-to-interview.2 Those most difficult to interview were also less likely than those in the standard sample to know that the Republican party has a majority in the U.S. Senate (57% vs. 63%).
Respondents in the rigorous survey, as well as those who were most difficult to reach, also were more apt to have no opinion about issues asked about in the survey. But the hardest-to-reach were similar to other respondents in their news consumption habits. There were no differences in the percentages saying they had read a newspaper, watched TV news, or heard the news on radio yesterday.
Trust and Safety Concerns
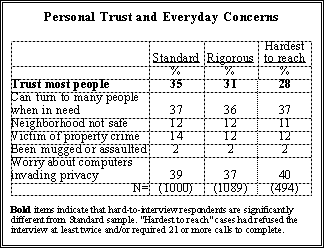
People who participated in the standard sample were somewhat more trusting of others than the more reluctant respondents. More than a third of respondents in the standard survey (35%) said that generally speaking “most people can be trusted;” fewer of those in the rigorous sample and people who were most difficult to reach expressed that sentiment (31%, 28% respectively).
But there were no differences in the extent to which respondents said they had many people they could turn if they needed help, or in their reported incidence of crime. The willing and the reluctant respondents reported similar levels of neighborhood crime, and were comparably concerned about threats to personal online privacy.

Party ID and Political Attitudes
In general, independents are harder to reach with commonly used survey techniques than are Republicans or Democrats. The standard survey conducted in early June included nearly identical percentages of Republicans (32%) and Democrats (31%), while 13% said they leaned to each of the two major parties. About one-in-ten survey respondents (11%) said they had no political affiliation and declined to lean to one of the parties.
The percentage of ‘true’ independents increased to 17% when rigorous sampling and interviewing techniques were employed. And independents comprised an even larger proportion of the hardest-to-interview respondents (19%). By comparison, Republicans made up a larger share of the standard sample (32%) than of the rigorous sample (26%) or the hardest-to-reach group (23%). The Democratic percentage of the groups was stable, regardless of the survey technique used.
There were only modest differences between the standard sample and the reluctant and less accessible respondents in ideology, and no difference in opinions about the two parties. The groups differed little in their views of whether there are major differences between the parties.
Few Differences Over Issues
Across a range of other social and political topics, participants in the standard and rigorous samples were similar in their attitudes and values. There were virtually no differences in opinion toward government, the poor, business, homosexuality and other issues.
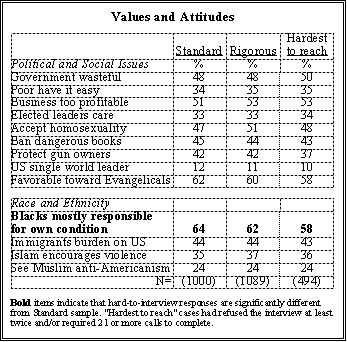
Moreover, respondents in the standard and rigorous samples, and the hardest-to-reach people, differed very little in attitudes about evangelical Christians, about immigrants, about the root causes of poverty among blacks, or about the role of Islam in encouraging violence.
Both the easy-to-interview and the hardest-to-interview expressed overwhelmingly favorable views of minorities, though respondents in the standard survey were more positive in this regard. But the hardest-to-reach were not more negative about minorities. Instead, somewhat fewer of them were willing to offer ratings of the various groups. Even when the analysis is restricted to white respondents only, there is no evidence that the least amenable and available interviewees were more hostile toward minority groups. In the 1997 survey, the hardest- to- reach respondents held less favorable views of minority groups than did more willing respondents. That was not the case in this study.
Lifestyles Also Similar
There were almost no significant differences between the standard and rigorous samples in responses to several questions about personal behaviors, family finances, health status, and church attendance. Roughly equal numbers of the easy and hardest-to-interview use the Internet, attend church every week, watch reality shows on television, or smoke cigarettes. Similar numbers describe their family as “struggling” and report not having had enough money for food or health care at some point in the past year.
However, somewhat more of the hardest-to-reach group (49%) said they went out three or more days a week in the evening when survey organizations conduct most of their interviewing. That compares with 45% of the rigorous sample and 42% of the standard sample.
 |
 |
Call Screening Widespread
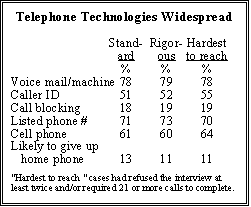
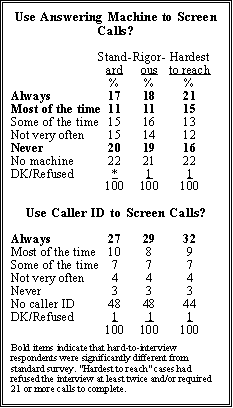
The vast majority of Americans report that their household has at least one type of device that can be used to control or screen their telephone calls. Roughly eight-in-ten respondents in the standard survey (78%) said they have an answering machine or voice mail, and 43% said they use these devices to screen their telephone calls at least some of the time. The results were similar among those who were interviewed in the rigorous survey, and among the hardest-to-reach respondents.
About half of the respondents in all three groups said they have caller ID, and 44% said they use it to screen calls at least some of the time. Roughly one-in-five respondents said they have call blocking or a privacy manager to stop certain calls from reaching the household. Overall, 88% in the standard survey said they have either an answering machine, caller ID or call blocking; nearly half (47%) have at least two of these items. Again, the results were comparable in the rigorous survey and among the hardest-to-reach.
Affluent households are more likely to have these technologies, but majorities of even the lowest income respondents in the survey said they have one or more of these devices in their home. While answering machines and voice mail are more common than caller ID, the latter is employed more regularly to screen calls, with 27% of the public saying they always screen calls with caller ID (compared with only 17% who say they always use an answering machine to do this). More African-Americans than whites have caller ID (73% vs. 47%) and a higher percentage of blacks always uses it for call screening (34% vs. 24%). Young people ages 18-29 are the group most likely to say they always screen calls with caller ID (41% say this), compared with only 12% those aged 65 and older.
Privacy managers or call blocking, which electronically stop certain calls from reaching a household, are less common. More women (20%) than men (14%) report using this technology.
But the study finds no evidence that the widespread use of call screening devices is in itself undermining the reliability of survey research. The percentage of households in which a personal contact was made during the five-day standard survey period was higher in 2003 than it had been in 1997 (76% vs. 69%), though more calls per telephone number were needed to achieve the desired number of interviews in last year’s survey. The “contact rate” for the rigorous study in 2003 was identical to that obtained in 1997 nearly every residential household identified in the sample (92%) had been contacted verbally at least once by an interviewer.
It is possible that call screening is even more prevalent among households in the sample where an interview was never obtained. The evidence on this point is mixed. There is no difference between the standard and rigorous samples in the use of technology to screen calls, but households that were especially difficult to interview those with two or more refusals or those that required more than 20 calls were somewhat more likely than the standard sample to report regular use of call screening. By and large, though, the current study provides confirmation of findings from early studies on answering machines: people may be using call screening technology as much to stay connected with the outside world as to hide from it.
Unreachable: Cell Users, Institutional Residents
Two kinds of people are missed by all telephone surveys: people who do not have telephone service at all, and those who use only a cell phone. In addition, most polls exclude people who live in institutions such as prisons or long-term psychiatric care facilities.
According to recent preliminary estimates from the federal government’s 2003 National Health Interview Survey, based on face-to-face interviews in 16,677 households, approximately 4.4% of U.S. adults do not have a land-line telephone in their residence; 2.8% have a wireless phone but no land-line service, and 1.6% have no telephone service at all.3 Cell phones are not yet included in most polling organizations’ samples.4
Compared with people with land-line telephones, those who rely solely on cell phones tend to be younger and more likely to live alone. People with no telephone service at all are much different demographically than those who have cell phones or land line telephone service: more of them are black or Hispanic, more live alone, they are less educated and have lower incomes
The Pew study asked current cell phone users how likely they were to give up their land-line phones in the near future. Overall, just 6% of standard survey respondents have a cell phone and say they are “very likely” to give up their land-line service. Another 7% say they are “somewhat likely” to do this.
Although excluding the 4.4% of adults with no land-line phone from surveys creates only a minor bias in the results overall, the omission of non-telephone households can be a more serious problem in surveys targeted specifically at low income families.