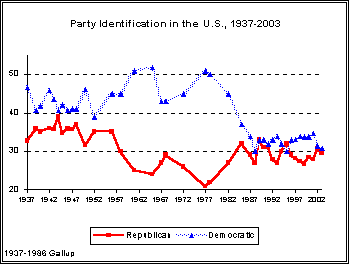
Parity in partisan affiliation is a relatively new phenomenon in American politics. For most of the period between the late 1930s through the beginning of the 21st century, the Democratic party held an advantage often sizable over the Republicans in party identification.
The Democratic lead in party identification was modest through the 1940s but grew dramatically in the late 1950s and early 1960s. The Democratic advantage narrowed in the mid-1960s, but remained substantial.
In the late 1970s, fallout from the Watergate scandal again boosted the Democrats while depressing Republican support.
In 1977, more than half of the public (51%) identified themselves as Democrats, compared with barely one-in-five who called themselves Republicans (21%).
The advantage was short-lived, however, as discontent with the economy coupled with internal divisions among Democrats increased the popularity of the Republican party in the electorate. With Ronald Reagan in office, the parties drew nearly even by the end of the 1980s.
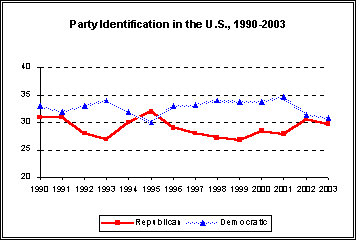
The Democrats held a small edge with the public in the early 1990s, but public unhappiness with Bill Clinton and a successful campaign by former House Speaker Newt Gingrich helped boost the Republicans ahead of the Democrats for a short time in 1995.
Following the government shutdowns in 1995, Democrats once again took a small lead in party affiliation through the remainder of the 1990s.
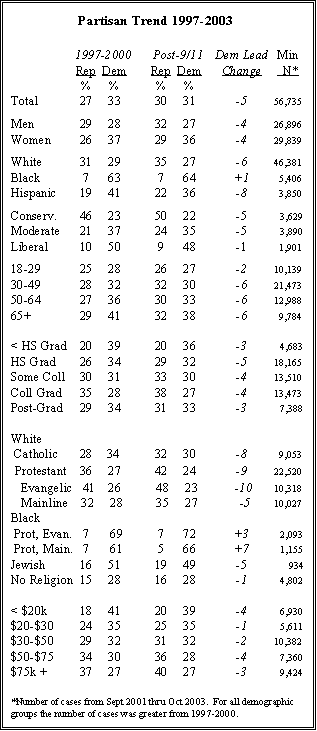
In Pew polls conducted during 1997 and 1998, 33% of adults said they thought of themselves as Democrats, with 28% calling themselves Republicans. This division persisted through the presidential campaign period of 2000 and the post-election period in 2001.
Post-9/11 Parity
The Sept. 11 terrorist attacks, and Bush’s response to the attacks, marked a major turning point in party identification. Republican party identification rose to 30%, while the Democrats fell to 31%, putting the parties into a virtual tie for the allegiance of the public.
Because Republicans traditionally turn out to vote in higher numbers than do Democrats, the current division in party affiliation among the public could provide the GOP with a slight electoral advantage, all other things being equal.
A striking feature of the post-9/11 shift in partisan identification is its breadth. The shift is seen in most major demographic and social groups in the population, and is fairly consistent in size.
Among these groups, the average decline in the Democratic advantage is five percentage points, but no group in the population shifted more than 10 points. Greater than average Republican gains in party affiliation are seen among white Protestants (nine-point shift after Sept. 11), white Catholics (eight points), and Hispanics (eight points).
Age, Gender and Partisanship
Older Americans are more Democratic than Republican in their party affiliation, while younger people are about equally divided between the parties. And as has long been true, younger people also are substantially less likely to identify with any political party.
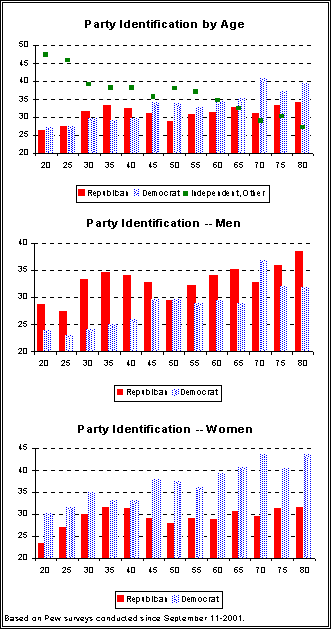
In addition to its lead among older Americans (those age 65 and older), the Democratic party holds a clear edge among the early Baby Boomers people in their middle 40s to late 50s.
But younger Baby Boomers and those in Generation X (roughly ages 30-44) are somewhat more Republican.
The parties are virtually even among the youngest cohort of citizens today.
These general patterns hold for both men and women, but there is also a big gender gap in party affiliation, as there has been since the early 1980s.
Women tilt Democratic by a margin of 36% to 29%, while men favor the Republican party by a margin of 32% to 27%.
Women in every age group are more Democratic than Republican, with the largest gaps occurring among those age 60 and older. But Democrats also have a big advantage among young women (ages 18-24) and Baby Boomers.
Among men, Republicans outnumber Democrats even among the Boomers, and indeed among every age group except those age 70-74.
In addition to the gender gap, there is also a substantial marital gap in party affiliation.
By 36% to 28%, married people are more Republican than Democratic; those who are divorced, widowed, separated, or never married are more Democratic than Republican (36% Democratic, 24% Republican).
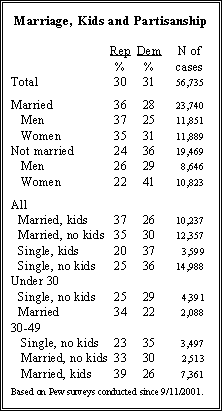
Married people with children tilt more Republican than those who don’t have children. Among people who are not married or who are separated, those with children are less Republican than those without kids.
Blacks Still Solidly Democratic, Hispanics Less So
Compared with other demographic groups, African Americans are by far the strongest supporters of the Democratic party. Overall, 64% of blacks describe themselves as Democrats, and another 21% say they lean toward the Democratic party.
Moreover, more than four-in-ten (46%) describe themselves as strong Democrats.
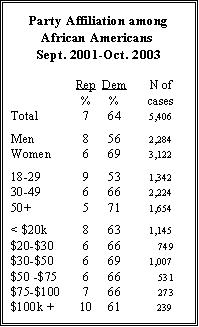
Just 7% of African Americans identify themselves as Republicans (another 3% lean Republican). African Americans were not part of the general shift toward the Republican party during the post-9/11 period. The Democratic advantage among blacks (64%-7%) is about the same as it was in the late 1990s.
While a gender gap is evident within the African American population as with whites, more women than men are Democrats there is a striking uniformity in Democratic affiliation across regions and the economic spectrum.
The most affluent African Americans are nearly identical in partisanship to the least affluent:
Among black respondents making less than $20,000 annually, Democrats outnumber Republicans by 63% to 8%; the margin is nearly as great (61%-10%) among blacks with incomes of at least $100,000 a year.
As is the case with whites, younger African Americans those under age 30 are less likely than their elders to claim a party affiliation.
Among African Americans who do identify with a party, the Democratic advantage is slightly smaller among younger than among older respondents.
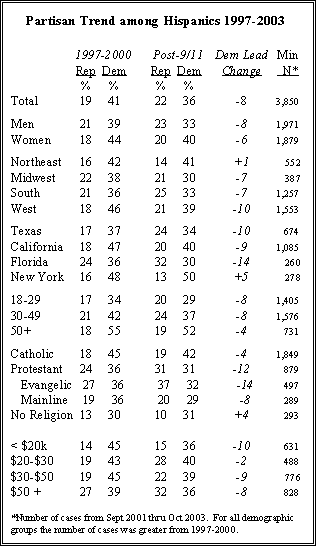
Hispanics and Latinos have also been an important constituency for the Democrats in many parts of the country. But there has been a somewhat larger partisan shift away from the Democratic party among Hispanics than among the public at large.
During the late 1990s, Democrats outnumbered Republicans among Hispanics by a margin of more than two-to-one (41% to 19%). In the aftermath of 9/11, Democrats still lead, but by a smaller margin (36% to 22%).
Republican gains have been greatest among Protestant Hispanics especially those who consider themselves evangelical Christians.
Among Catholic Hispanics, there has been little change in partisan identification.
The Northeast is the only region where the Democratic party has held its own. Hispanics and Latinos living in that region are just as Democratic today as before Sept. 11.
But in several key battleground states in other regions notably Florida Republicans have made gains. With its conservative Cuban-American population, the Sunshine State’s Hispanic population is among the more politically diverse in the country, though Democrats outnumbered Republicans by 12 points during the late 1990s. Today, Republicans have a slight advantage over Democrats, 32% to 30%.
Red, Blue and Swing States
The Republican party’s gains in affiliation, if sustained into next year’s general elections, may produce small but nevertheless important changes in the terrain on which the elections will be fought.
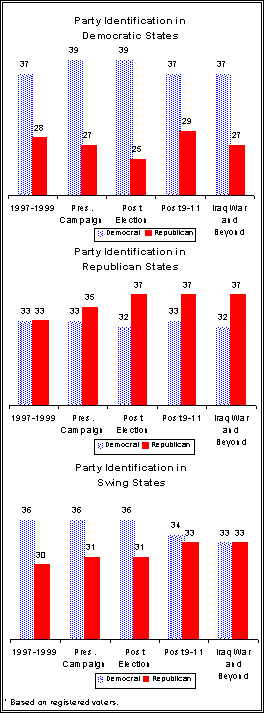
Compared with the 2000 campaign, Republicans now have an edge among registered voters in party identification in the states that have been voting their way over the past three election cycles so-called Red states and have achieved parity with the Democrats in swing states.
Before the 2000 campaign, the parties were at parity in states that had been dependably Republican in presidential voting (33% Democratic, 33% Republican). Following the election, the Republicans took a 37% to 32% advantage in these states, a lead that is unchanged today.
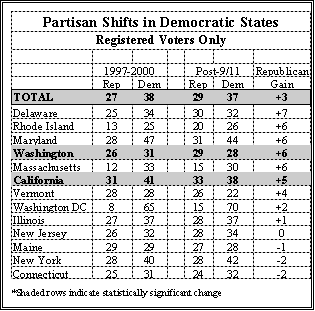
During the 2000 campaign, Democrats held a 12-point advantage in voter affiliation in states that consistently voted Democratic at the presidential level (39% Democratic, 27% Republican).
After Sept. 11, Democratic identification in the Blue states declined to 37% and Republican identification rose to 29%; the Democratic advantage in these states has grown slightly in the aftermath of the war in Iraq (now 37% Democratic, 27% Republican).
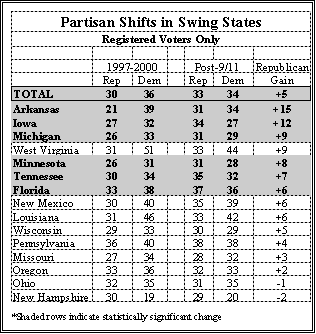
Swing states tilted nearly as Democratic as the Blue states in the late 1990s. Even after the 2000 election, Democrats maintained a 36% to 31% advantage over the Republicans in these states. But after 9/11, this gap closed: swing states now divide evenly: 33% Democratic, 33% Republican.
GOP Gains in Key States
Republicans have made notable gains in a number of key swing states. Michigan, Minnesota and Iowa three Midwestern states Al Gore won in 2000 by very slight margins have all experienced significant shifts in party ID toward the GOP. And the five-point advantage enjoyed by Democrats in Florida in the run-up to the 2000 election has evaporated. In polling since Sept 11, 2001, 37% of Floridians call themselves Republicans, 36% Democrats.
Not all swing states have moved Republican, however. In Ohio and Missouri, for example, there has been little change in self-reported party identification over this time period.
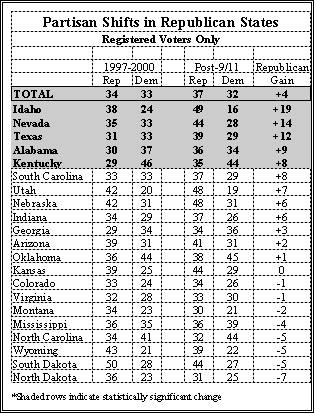
In a number of the Red states that voted Republican in the 1992, 1996 and 2000 elections, party identification continues to grow for the GOP. Texas, which was divided almost evenly between Democrats and Republicans prior to the 2000 election, now shows a significant ten-point Republican identification advantage. And the Democratic identification advantage in Alabama has completely disappeared since 9/11.
In most cases, Democrats maintain an advantage in Blue states that have consistently voted Democratic over the past three presidential election cycles. Even here, however, the GOP has made some inroads, including a slight but statistically significant change in California. A 41% to 31% Democratic party identification advantage has narrowed to a mere 38% to 33% advantage since 9/11. This was based predominantly on surveys conducted before the gubernatorial recall process was underway.(1)
Profiling Early Primary States
Critics of the presidential nominating process often charge that the states that hold primaries early in the process are unrepresentative of the broader party membership.
But for the Democratic party in 2004, the early states look fairly similar to those whose elections are later in the primary process. Of course, those who actually vote will be a subset of more motivated Democrats, and they could be different by virtue of the intensity of their feelings.
Democratic registered voters in Iowa and New Hampshire, who have the first opportunity to judge the field, are much less racially and ethnically diverse than the party as a whole, and may be slightly less conservative.
But they are similar to Democrats nationally in terms of labor union affiliation, religion, age, and education. Voters in the states that hold nominating contests Feb. 3 (including South Carolina, Missouri and Arizona) look much like the larger Democratic electorate on most characteristics.
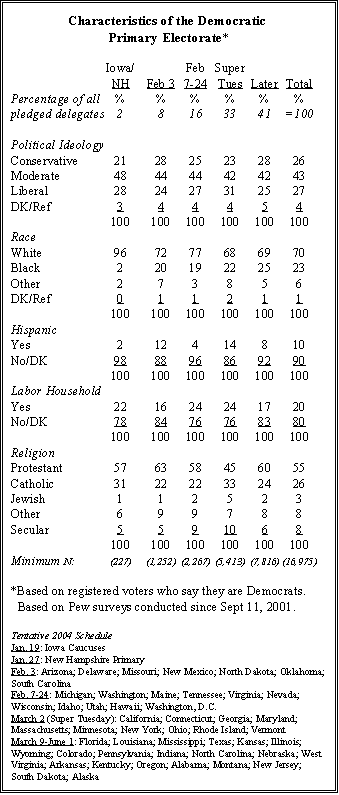
Taken together, the primary and caucus electorates that vote prior to Super Tuesday (the big cluster of states holding contests on March 2), look very much like Democrats elsewhere in terms of their basic political values.
1. States are categorized based on presidential vote in the 1992, 1996, and 2000 elections. Democratic states are those that favored Clinton and Gore by margins significantly higher than the national average. Republican states, likewise, favored the Republican candidates more than the average. Finally, swing states are those that have divided between the candidates or have been won by margins very close to the national average in each year. The tables on this page and the previous page combine surveys from 1997 through 2000, and surveys taken after Sept. 11 to the present.