The Public’s Mood Mellows
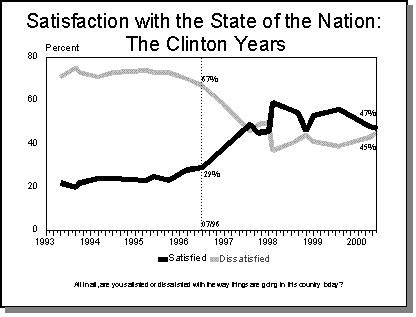
Satisfaction with the state of the nation is down slightly over the past 12 months, though still high relative to the early 1990s. In the current survey, 47% of citizens say they are satisfied with the way things are going in the country, down from recent highs of 56% in August 1999 and 59% in February of 1998. Dissatisfaction is at 45%, the highest level since January 1998.
This recent falloff in satisfaction has occurred in nearly all segments of society, but has been particularly pronounced among Hispanics and African-Americans. Only 39% of blacks say they are satisfied with the state of the nation, and 50% say they are dissatisfied; in August 1999, fully 56% of African-Americans were satisfied and 39% dissatisfied. A similar decline has occurred among Hispanics. Just 52% of Hispanics say they are satisfied today, compared to 67% last summer.
Politically, Democrats remain more satisfied with the nation’s direction than Republicans, by a 56% to 39% margin. But the partisan divide has narrowed since last August — when it stood at 70%-47% — because of a 14-percentage point drop in satisfaction among those identifying themselves as Democrats. Dissatisfaction also remains high among self-described conservatives, 55% of whom are unhappy compared to 39% of moderates and 40% of liberals.
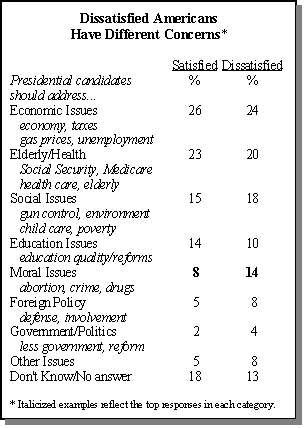
This rising public dissatisfaction appears to be rooted, in part, in moral, social, and political concerns. Dissatisfied citizens are more likely to say that they want to hear the presidential candidates talk about moral and social issues — such as abortion, crime and drugs, child care, and poverty — than those who are satisfied with the state of the nation.
Whether this shift in the public mood will negatively affect Gore’s electoral prospects is unclear. On the one hand, satisfaction is clearly related to candidate preferences. Among those who say they are satisfied with the state of the nation, Gore leads Bush by a solid margin, 57% to 36%. Among those dissatisfied, Gore trails 34% to 55%. Yet Clinton was able to win reelection four years ago although public satisfaction was much lower than it is now.
Accompanying this latest shift in mood is a modest increase in concern over the economy. More Americans (24%) expect economic conditions to be worse a year from now than expect to see the economy improve (15%). By contrast, in the fall of 1998 only 17% thought the economy would get worse in the next year and 18% were optimistic. But this rising anxiety may reflect a perception that the economy is already so strong that it is unlikely to improve even more, rather than a deepening pessimism.
In fact, the dominant view among the public is that the economy will probably not change one way or the other over the next year. Most Americans (55%) believe economic conditions in the country will remain the same. Moreover, 52% of respondents say their personal financial situation is either excellent or good, a percentage which has remained steady since the mid-1990s.
Fund-raising Flap Boosts Bush
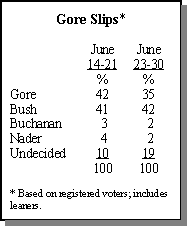
While the presidential race has remained close over the past several months, the renewed focus on Gore’s role in the Democrats’ 1996 fund-raising efforts appears to have boosted Bush’s standing. The Pew Research Center poll was conducted in two waves, with the first set of interviews ending June 21, the day before newspapers reported there had been a new recommendation for an Independent Counsel to look into Gore’s 1996 activities.
At that point, the vote in a two-way match-up was evenly divided: Gore 46%, Bush 45%. The race was equally tight with third-party candidates Pat Buchanan and Ralph Nader on the hypothetical ballot: Gore 42%, Bush 41%, Buchanan 3% and Nader 4%. But in polling conducted June 23-30, after the fund-raising story broke, Bush had a slight edge over the vice president, 42%-35%.
Many Democrats Ambivalent
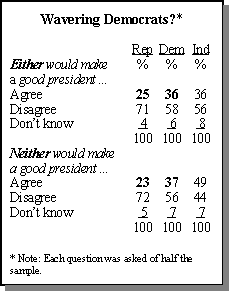
Voters are surprisingly ambivalent about the outcome of this election, perhaps because of the competitiveness of the race and the lack of defining issues. Significant minorities say it is difficult to choose between Gore and Bush because either would make a good president, or alternatively, because neither could do the job.
As with many issues, there is a clear generational pattern in responses to these questions, with those under age 50 more likely to have a hard time choosing between Gore and Bush. Among this younger group, 36% say either candidate would make a good president, compared to 27% of those over age 50. Similarly, 41% of those under age 50 say neither would make a good president, compared to 29% of those 50 and older.
There are also significant partisan differences, which point to Gore’s potential weakness within his own party base. Democrats are more likely than Republicans to say either candidate would make a good president. And fully 37% of Democratic Party loyalists say it’s difficult to choose between Gore and Bush, because neither would make a good president — hardly a vote of confidence for the vice president. This compares with only 23% of Republicans who say neither man is capable of performing as president. Independents are more likely than either major party group to share this negative sentiment: fully 49% think neither candidate is up to the job.
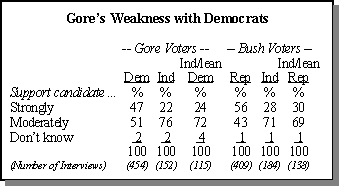
This lack of enthusiasm on the part of Democrats is again demonstrated in the intensity of each candidate’s support. Respondents were asked whether they support their candidate of choice strongly or only moderately. Overall, Bush has slightly more strong supporters than does Gore: 44% vs. 40%, respectively.
But Bush receives strong support from a solid majority of the Republicans who support him (56%), while fewer than half (47%) of the Democrats who support Gore characterize themselves as strong supporters. At this point, independents are not firmly in either candidate’s camp. However, Bush’s independent voters are slightly more likely than Gore’s to identify themselves as strong supporters.
Majority Says Bush Will Win
All of this means that the race is extremely fluid. At this point, for instance, there doesn’t seem to be a significant gap between likely and unlikely voters in terms of their candidate preferences. Likely voters divide evenly between Bush and Gore — 47% for each, with 6% undecided.(1) Those who are less likely to vote are also evenly divided, though more are undecided (13%).
[Note 1. Likely voters are identified by their answers to five questions concerning interest in the election and past voting behavior.]
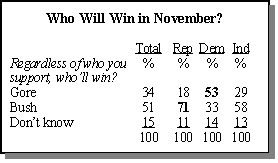
But in spite of the inability of many people to make up their minds, a thin majority of the public thinks Bush will prevail in November. When asked who they think the likely victor will be, regardless of who they themselves support, 51% of Americans point to Bush, only 34% think Gore will win, and 15% aren’t sure how it will turn out.
Republicans have much more confidence in their nominee than Democrats have in theirs. Fully 71% of Republicans think Bush will win the election, compared to only 53% of Democrats who say the same about Gore. By a two-to-one margin, independents expect Bush to triumph. The public’s predictions were quite accurate in the summer of 1996, when 71% said Clinton would likely win the election and only 19% said the same about Dole.
Bush’s Edge on Personal Traits
Gore supporters continue to point to his stand on the issues as his strongest selling point, and voters give him little credit for his more personal qualities. When asked what they like most about the vice president, 42% of Gore voters say it’s his stand on the issues, 29% point to his experience, and only 20% choose his personality (7%) or leadership ability (13%).These numbers have changed very little since the fall, suggesting that voters are no more attracted to Gore on a personal level today than they were at the outset of the campaign.
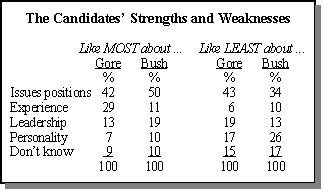
Bush supporters are also drawn primarily to the governor’s policy positions. Fully 50% of them say Bush’s stand on the issues is what they like most. But Bush receives slightly higher marks than Gore on the more personal dimensions: 29% cite his personality (10%) and leadership ability (19%) as his strongest selling points. Not surprisingly, experience is less of a plus for Bush. Only 11% say this is what they like most about the candidate. Again, these numbers are largely unchanged from recent months.
When asked what they like least about each of the candidates, a plurality of Bush supporters point to his issue positions as his biggest liability. More than four-in-ten (43%) of Gore’s detractors say his stand on the issues is what they like least about the vice president. Roughly one-third (36%) point to personal qualities (17% personality and 19% leadership). A mere 6% take issue with Gore’s experience.
Among Bush detractors, personal qualities are more of a turnoff than the governor’s issue positions. Roughly four-in-ten Gore supporters (39%) say what they don’t like about Bush is his personality (26%) or leadership ability (13%). Slightly fewer (34%) point to his policy positions.
Bush’s stand on the issues is more of a problem for young voters than older ones. Fully 54% of Gore supporters under 30 say Bush’s position on the issues is what they like least about him, compared to only 19% of those 65 or older.
Gore Leads on Key Issues
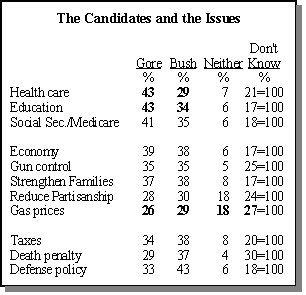
On the issues citizens most want to hear about from the candidates — education, health care, Social Security and the economy — Gore is generally seen as the superior candidate. When asked which candidate would do the better job improving the health care system, 43% choose Gore, while just 29% opt for Bush. Gore also leads Bush by nine points on education (43% to 34%) and six points on keeping Social Security and Medicare sound (41% to 35%). Gore’s advantage on education represents a significant change from the spring. In March, Bush was seen as the candidate better able to improve education, by a 44% to 41% margin.
Bush has the edge when it comes to who is better able to make wise defense policy decisions (43% Bush, 33% Gore) and representing people’s views on the death penalty (37% Bush, 29% Gore). But a sizable minority (30%) is unsure of which candidate best represents their views on that controversial issue.
Neither candidate has a clear advantage in being viewed as better able to control the price of gasoline. While 29% choose Bush and 26% say Gore would do better, 18% volunteer that neither would do a good job and 27% are undecided. Bush held a formidable advantage on this issue in March. At that time, he out-polled Gore on being better able to control gas prices, 41% to 25%.
Education, Social Security, Medicare and health care are seen as Gore’s strongest issues by those who support him for his policy positions. Roughly eight-in-ten of these voters say Gore would do a better job than Bush of dealing with each of these issues. On the other hand, Bush voters who say they like the governor’s policy positions view foreign policy, family values and taxes as his biggest strengths. More than three-quarters say Bush could best Gore on each of these issues.
Character Crucial for Bush
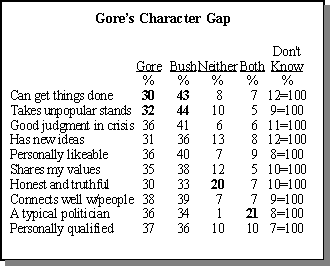
Though Bush trails Gore on a number of issues, he receives far better marks when it comes to character evaluations — particularly those relating to the candidates’ leadership abilities. Fully 44% think Bush is more “willing to take a stand, even if it’s unpopular,” and 43% see Bush as the candidate who “can get things done.” Gore gets the nod on these traits from only 32% and 30% of the public, respectively.
Bush also leads Gore in being perceived as using good judgment in a crisis (41% Bush, 36% Gore), having new ideas (36% Bush, 31% Gore), and being personally likeable (40% Bush, 36% Gore), though by smaller margins. When it comes to other traits such as honesty, qualifications and the ability to connect well with ordinary Americans, neither candidate has a clear edge. However, a certain amount of voter cynicism can be seen in the fact that 21% of respondents volunteered that the phrase “a typical politician” described both candidates well, and 20% offered that neither candidate was “honest and truthful.”
Younger Women, Older Men Divided
The dynamics of the presidential race continue to be influenced in part by the fluctuating preferences of women. While men have consistently preferred Bush to Gore over the past 18 months, women have frequently changed course. Most recently, women favored Gore over Bush by an eight-point margin in the first wave of interviewing for this survey. In the second wave, however, they divided equally between Gore and Bush. In 1996, Clinton’s advantage in the women’s vote never faltered. Throughout the year, he sustained a double-digit lead over Dole among women.
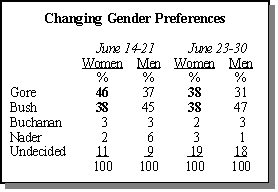
But not all women are having doubts about Gore. Women age 50 and older have generally supported the vice president, but Gore’s support tends to be weaker among women under age 50. For Bush, older men pose a challenge. Men age 50 and older have gone from favoring Gore by 10 points in March, to preferring Bush over Gore by an equal margin in May, and now opting narrowly for Bush. Until these swing groups settle into one camp or the other, the race may continue to fluctuate.
In addition to the gender gap, there is a particularly large “marriage gap” in voting preferences this year. Overall, Gore trails Bush by 13 percentage points among married people (39% to 52%) but leads Bush by 18 points among those who are unmarried (55% to 37%). In June 1996, Clinton led in both groups, though by a smaller margin among the married (50%-46%) than the unmarried (62%-33%).
The differences between 1996 and 2000 are even more striking when both marital status and gender are considered at the same time. While Clinton led Dole among married women 53% to 43%, Gore trails Bush 42% to 50%. In June 1996, married men were evenly split between Clinton and Dole. This year Bush holds a commanding 54% to 36% lead in this group.
Clinton’s 20-point lead over Dole among single men has shrunk to a mere 4-point Democratic edge this year (48% Gore, 44% Bush). Gore’s strongest support comes from single women, who prefer him nearly two-to-one over Bush (60% to 31%). However, even this 29-point lead among single women still falls short of Clinton’s commanding 37-point advantage over Dole among single women in 1996.
Bush Leads Among Parents
Gore has failed to attract strong support among parents with children under 18 in the home, who make up 33% of the registered voters sampled. In particular, while Clinton was able to win the support of 54% of mothers, Gore currently trails Bush among mothers 45% to 48%. Bush holds a 17-point lead of 53% to 36% among fathers, who were evenly split between Clinton and Dole at this time in 1996.
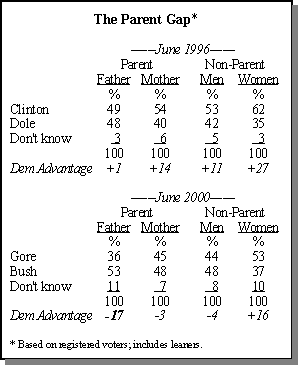
Gore’s difficulties among men extend to those who do not have children as well. Clinton led Dole 53% to 42% among male non-parents in 1996, while Gore trails Bush 44% to 48% this year. And though Gore does lead among women who are not parents, 53% to 37%, this still falls short of Clinton’s 62% to 35% advantage among these women in 1996.
Catholics Narrowly Favor Bush
Members of major religious groups are also expressing different preferences in this election cycle compared to 1996. Not surprisingly, Bush leads Gore among white evangelical Protestants (65%-28%).
However, the candidates are running even among mainline Protestants and white Catholics. In 1996, Clinton enjoyed an 11-point lead over Dole among non-evangelicals, and Catholics preferred him by nearly a two-to-one margin (62%-34%).
Gore leads Bush among secular voters in the two-way match-up (46%-40%). However, in a four-way contest (with Nader and Buchanan included), some of these voters abandon the vice president in favor of Nader. Seculars are three times more likely than the general public to support Nader (13% vs. 4% of the general public). In 1996, Clinton held a commanding 67%-30% lead among seculars.
Ultimately, however, the race will hinge on the preferences of political moderates. Fully 91% of conservative Republicans and liberal Democrats are solidly behind their respective candidates. However, among moderate-to-liberal Republicans and moderate-to-conservative Democrats, roughly 20% currently support the other party’s candidate.
Nader, Buchanan Have Little Effect
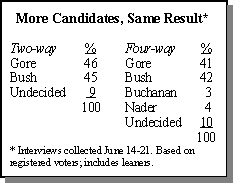
The overall impact of adding Nader and Buchanan to the race is, at this point, negligible. Combined, the two pull in a mere 7% of the vote. Buchanan’s strongest support comes from men under age 30, 7% of whom say they would vote for the former TV talk show host. Nader’s strongest supporters are middle-aged men and political independents. Nonetheless, neither of the third party hopefuls are able to draw in even 10% of any major demographic group.
The supporters of these alternative candidates have distinctive views about the campaign and the candidates. Overall, they are much less satisfied with the state of the nation than are most Americans. By a margin of 57%-38% they say they are dissatisfied with the way things are going in the country today. This compares with 45% dissatisfied vs. 47% satisfied among the general public. They are also less approving of the job Clinton is doing (49% approve vs. 56% of all Americans). Even so, they prefer Gore over Bush, when forced to choose between the two (48%-38%).
These voters are extremely dissatisfied with their choices for president this year. Fully 70% say they’re not satisfied with the likely presidential candidates, compared to only 34% of the public. In addition, nearly half (46%) see Bush and Gore as pretty similar in their positions on issues; just 33% of the public takes that view. And fully four-in-ten say, if given the chance, they would cast a vote of no confidence in all the candidates running for office this year. Only 19% of the public expresses this view.


