Foreword and Overview
Foreword
In 1987, we embarked on an ambitious project to better understand the nature of American politics. We identified a broad range of beliefs and values that underlie common political labels and that ultimately drive political action. A voter typology emerged from this effort which classifies the electorate into distinct groupings, defined by their political, social, economic, and religious beliefs. Five years ago, we updated our study, finding a dramatically changed political landscape.
Today, we release version 3.0. Once again, we have found evidence of critical shifts in the electorate since 1994. The strong economy of the late 1990s has produced greater financial security and higher levels of satisfaction with the state of the nation. Reflecting this new public optimism, distrust of government and elected officials is down, and Americans express more tolerance for outsiders and a greater willingness to help the poor.
Our new study is based on three comprehensive surveys of nearly 5,000 Americans nationwide. This voter typology provides new insights into the nature of the electorate, the parties, and American politics as we approach the 2000 elections.
As with each new voter typology, we are able to measure long-term changes in the electorate by drawing on more than ten years of the Center’s comprehensive surveys of the American public. Since 1996, this work has been generously supported by the Pew Charitable Trusts. Times Mirror sponsored our work between 1987 and 1995. We are grateful for the support that has made these extensive studies possible.
Andrew Kohut Director Pew Research Center for The People & The Press
Retro-Politics
The new politics of the American people looks more like the old politics than anything the Center has observed in its 12 years of surveying the underlying political, social and economic attitudes of the electorate. The mood, party divisions and fault lines of the public are more traditional than what we found in 1987 at the end of the Reagan era or in 1994 on the eve of “the Gingrich revolution,” when the benchmark studies in this series were conducted. The current polling, based on nearly 5,000 interviews with national samples of the voting age population, identifies the following back-to-the-future trends.
The middle of the electorate is not dominated by angry, economically stressed voters whose allegiances are up for grabs, as we found in 1994. Rather the most important swing constituency is among the least angry, most moderate and most financially content segment of the voting public.
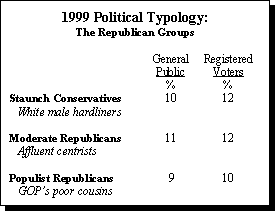
The Republican Party is no longer principally bifurcated between laissez faire economic conservatives on the one hand and populist social conservatives on the other, as we first described it in 1987. A clear well-defined, moderate wing of the party emerges.
Indeed, centrism, so characteristic of post-war American politics, is back. More moderation is not only apparent among Independents, but also evident on the right and on the left. Fewer Americans are highly critical of government. Political cynicism, while extensive, has lost some of its edge, and clearly voters are less interested in outsiders and political newcomers than they were earlier in the decade.
Democratic chances to retain control of the White House are once again threatened from within by social conservatives, who have rejected their party’s standard-bearer to some extent in every Democratic defeat since 1968. In this cycle, the issue for them is not principally ideological, but rather a hangover from the scandals of the Clinton administration.
Thanks to the Gingrich legacy, once again the Democratic Party has more adherents than the GOP. The Democrats have an even bigger image advantage over the Republicans owing to public hostility over impeachment. However, as has been the case in the past, these advantages may mean much more to congressional politics than to which party wins the presidency.
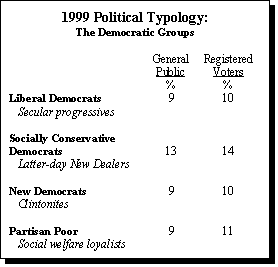
The Center’s political typology, which sorts voters into homogeneous groups based on political beliefs, party affiliation and voter participation, found striking parallels on both ends of the political spectrum. The new voter groupings on the right and the left are characterized by significant political centrism, as well as populism, at the expense of ideological consistency.
Many Americans continue to use the liberal and conservative labels, but only two segments of the electorate express coherent ideological points of view — Staunch Conservatives are consistently conservative on economic, social and international issues, while on balance, Liberal Democrats take the opposite position on each dimension.
Moderate Republicans and New Democrats are about as numerous as Conservatives and Liberals and hold much more centrist views. Moderate Republicans are less critical of government, more interventionist, more environmentalist, more tolerant, and less pro-business than Staunch Conservatives. They are also less loyal to the GOP. Although 98% Republican, 44% of them approve of Bill Clinton’s job performance.
New Democrats have less compassion than others in their party for the disadvantaged and are less critical of business. Yet like most Democrats, they express support for government and are more socially tolerant than the conservative wing of the Democratic Party. Reflecting their moderate views, fully half would consider voting for George W. Bush.
Populist Republicans and their Democratic counterpart, Socially Conservative Democrats, have mixed ideological values and have also contributed significantly to the crossover support for Clinton and now Bush, respectively. Populist Republicans are highly religious and socially conservative. But they have more moderate opinions about government and less favorable opinions of business corporations than Staunch Conservatives. Nearly one-third approve of Clinton’s job performance, and barely half give a good grade to the GOP’s congressional leadership.
On the Democratic side, Social Conservatives hold similar opinions about freedom of expression, homosexuality and immigrants. However, they have much stronger ties to unions, are more financially satisfied and show a penchant for partisan defection. Like their Reagan Democrat predecessors, 55% say there is at least some chance they would vote for Bush, and 29% backed him over Al Gore when this poll was first taken.
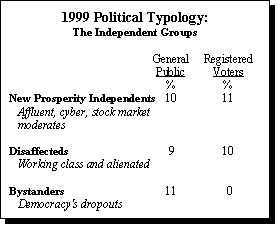
While the defections of Populist Republicans or Democrats might prove decisive in a close election, the most votes up for grabs are in the middle of the electorate. The two politically independent groups, one upbeat in its views and the other downbeat, contain many former Ross Perot voters who look at the political scene differently than most Democrats and Republicans.
New Prosperity Independents are moderate, young to middle-aged voters whose affluence, Internet savvy and stock market investments lead them to strongly endorse the status quo. But while 55% of this group, which strongly favors both handgun control and a capital gains reduction, approve of Clinton, just 24% are inclined to vote for Gore.
Disaffecteds, who are at the opposite end of the socioeconomic spectrum and are alienated and cynical rather than confident and upbeat, hold many similar political views. But, they are less important as voters because of their limited participation. In contrast, the Partisan Poor, who are also financially stressed, vote much more regularly. This most racially mixed bloc looks to government for solutions to its problems and remains strongly loyal to the Democratic Party. This is the only voting bloc in the country that wishes Clinton could run for a third term.
Americans’ Attitudes Mellow
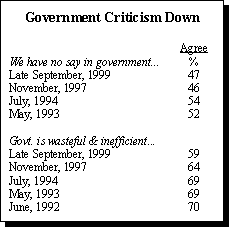
The moderating trend in these political groupings reflects changes in underlying attitudes that the Center has monitored since 1987.1 The current national survey finds somewhat less political cynicism and fewer people highly critical of government than in the past, and especially in comparison to 1994 when the Center developed its last version of the typology. For example, fewer Americans now think they don’t have any say in what the government does, and a smaller percentage believe that things run by the government are usually inefficient and wasteful.
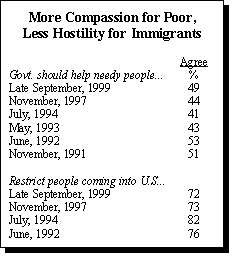
At the same time, the polling shows more compassion toward the poor and less hostility toward immigrants. A greater percentage in this survey than in the recent past think the government should do more to help needy people, and fewer express strong support for tightening our borders to further restrict immigration. Both of these trends may reflect the increased economic satisfaction and diminished financial pressure registered in this year’s survey. Gains in economic contentment have been greatest among upper income groups, while people in the lowest income category report less financial pressure but no more financial satisfaction than in the mid-1990s. Unexpectedly, despite these trends, Americans report no greater satisfaction with their wages than in the recent past. In fact, middle-income people are less satisfied than they were in 1994.
A diminished appetite for political change is apparent, along with the moderating political attitudes we observed. The percentage of respondents who say that Washington needs new faces is lower than in the mid-1990s: Today 49% want new faces, down from 60% in 1994. The percentage saying it’s time for current leaders to step aside has fallen somewhat as well (73% today vs. 79% in 1994). However, the survey also found less interest in national affairs and Washington politics than did previous polls in this series.
No Big Issue, But a Moral Undertone
As in other surveys, no overarching issue emerges as the electorate’s number one priority. If there is one theme in public concerns, however, it is a worry about the nation’s moral health. This is voiced in a variety of ways by one-third of respondents in open-ended questioning. Respondents mention family values, teen violence, crime, and other moral shortcomings. But, when these same people are asked about priorities, moral concerns get highest priority only from Staunch Conservatives and Populist Republicans. Improving education is the top priority of the pivotal New Prosperity Independents as well as Liberal Democrats, while the more conservative Democratic groups place more emphasis on dealing with entitlements.
Surprisingly, Republican groups are more divided on the specific policy questions than are Democrats. Staunch Conservatives express opposition to a minimum wage hike, HMO reform and gun control, whereas Populists and Moderates back these proposals. Foreign policy issues also divide the GOP. Fully 69% of Staunch Conservatives oppose American involvement in Bosnia and Kosovo, while 69% of Moderates back it and Populists lean against it. Democrats are divided on abortion. Socially Conservative Democrats and the Partisan Poor strongly favor parental consent; Liberal Democrats are evenly divided on this issue.
“Bush Coalition” Familiar
Bush’s patterns of support are reminiscent of winning GOP coalitions in the recent past. The Texas governor’s candidacy has very strong backing from all three core GOP groups: Staunch Conservatives, Populists and Moderates. He also gets the support of Independent voters at both ends of the economic spectrum. Affluent New Prosperity Independents strongly support him, and even Disaffected Independents lean to Bush.
Like Ronald Reagan before him and his father in 1988, George W. also has considerable appeal to the conservative wing of the Democratic Party — especially the Social Conservatives. Liberal Democrats and the Partisan Poor give Gore the most early support, but their enthusiasm is more muted than that shown by core Republicans for Bush. This survey finds that Clinton fatigue is more of a factor in the potential defections of Social Conservatives than for other Democratic groups. However Gore’s own leadership image is relatively weak among most Democrats, and very weak among Independents.
Former New Jersey Senator Bill Bradley tested as well against Bush as Gore did when this poll was taken, even though many voters may still know little about him. Bradley has more appeal to Independent voters, especially affluent New Prosperity Independents, and he has more crossover appeal to Republicans.
Bush is the prohibitive favorite for the nomination among all GOP groups, and a majority in every typology group except Liberal Democrats and the Partisan Poor would at least consider voting for the Texas governor next November. In contrast, it is mostly Staunch Conservatives, Moderate Republicans and New Prosperity Independents who would consider voting for Steve Forbes. John McCain appeals to two groups who agree on little else, Staunch Conservatives and Liberal Democrats. Among voters who have heard of him, Gary Bauer gets the most consideration from Populist Republicans, but even among this receptive group relatively few know of him.
The Reform Party’s Patrick Buchanan and Minnesota Governor Jesse Ventura are known to more than 80% of voters, but less than 30% say there is some chance they would cast a ballot for either of them. The former pundit and speech writer has somewhat greater appeal among Staunch Conservatives, while Independent Disaffecteds are a little more drawn to the former pro wrestler. However, both are more appealing to young voters than older people.
The poll finds voters looking for the same personal qualities in a president as they did four years ago: good judgment in a crisis, high ethical standards and compassion. But more now say that a president should serve as a role model to help keep families together and improve the nation’s moral health. These opinions are shared for the most part by all voter groups, but Republicans, especially Staunch Conservatives and Populist Republicans, place more emphasis than Democrats on the president as a role model. Only Staunch Conservatives give short shrift to compassion in a president.
Democratic Edge in Congressional Elections
Although Democrats are potentially less unified than Republicans with regard to presidential voting intentions, they seem more inclined to get behind their party’s congressional candidates than do Republican groups. For example, Moderate Republicans and Populist Republicans do not match Staunch Conservatives in their support for their party’s congressional candidates.
This contributes to the Democratic Party’s 49% to 43% lead in the congressional ballot test in this survey. However, the GOP’s losses in adherents and image weakness in recent years contribute as well. Collations of national Pew Research Center surveys of more than 10,000 respondents per year over the decade find affiliation with the GOP at 27% in 1998 and 1999, down from 30% in 1994 and 32% in 1995. Democratic affiliation has increased only marginally during that period. However, more Americans hold a favorable opinion of the party than did in 1994 (59% vs. 50%) while many fewer have a positive opinion of the GOP over that same period (53% vs. 67%). Although the Republican Party’s favorability ratings have rebounded somewhat from backlash against it for pushing impeachment, voters continue to express more confidence in the Democrats on most issues, save morality and taxes.
These trends notwithstanding, since 1990 increased majorities of both Republicans and Democrats say that they sometimes vote for the other party.
Other Findings:
The survey contains one cautionary note about George W. Bush’s strong showing in the polls, when it finds that 70% of all voters questioned think that he will be elected president in November. This is nearly identical to the percentage who felt that way about his father in the fall of 1991!
Support for a third party has been up and down in Center surveys, and the new polling finds a 54% majority saying that the country needs a third major political party.
The falloff in Republican Party affiliation is most dramatic among young Americans. Young men have migrated toward the Democratic Party while young women have become more independent.
HMO reform has become a bipartisan issue. Republican support has increased 14 percentage points in the last year, from 36% in 1998 to the current 50%. Support among Independents has increased from 44% to 65% this year. Among Democrats, the percentage has gone from 63% to 73%.
These are the results of three nationwide Pew Research Center surveys conducted over the last four months. The main typology survey of 3,973 adults was conducted July 14 – September 9, 1999, and has a margin of error of plus or minus 2 percentage points. Additionally, a sample of 1,411 adults who were interviewed for the main survey were re-interviewed during a second poll conducted October 7 – 11, 1999. Finally, the results for the Center’s longstanding political values measures are based on a survey of 985 adults conducted September 28 – October 10, 1999.