The potential for conducting public opinion surveys online is a hot topic today. With the Internet’s tremendous growth, an online poll can now compile literally tens of thousands of opinions quickly and at a fraction of the cost of traditional telephone surveys. Already many commercial websites invite people to voice their views on a range of issues. But so far, even systematic attempts to poll online have met with mixed success.
The findings from two simultaneous Pew Research Center polls — one online and the other by telephone — are remarkably similar on some important issues. But conflicting results on other questions reveal significant attitudinal differences between the general public and those who participate in online polls. People who took part in the Internet poll pay closer attention to election news, place a slightly higher priority on national issues and are more supportive of Clinton’s impeachment. These differences are evident even when the online sample is statistically adjusted to account for the under-representation of some demographic groups.
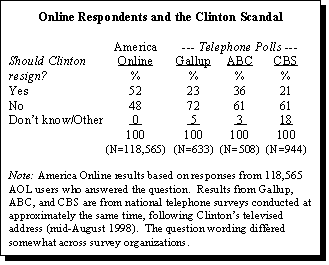
Reaction to the Clinton-Lewinsky scandal offers a clear example of the differences between opinions collected online and those measured through more traditional methods — telephone surveys of randomly-selected adults nationwide. People who participated in an online poll sponsored by America Online (more than 118,000 in all) were divided over whether Clinton should resign: 52% said yes; 48% no. Several national telephone surveys conducted at about the same time found just the opposite. Each of these national polls found a solid majority of people saying Clinton should not resign, in most cases by more than two-to-one margins.
Similarly sharp differences are evident on other questions as well, and they do not occur simply because one poll is conducted on a personal computer and the other on a home phone. Instead, the conflict stems largely from who participates in each type of poll. In telephone surveys, respondents are randomly selected, while most online poll respondents are self-selected — meaning people decide for themselves whether or not to participate. What’s more, online polls are necessarily limited to the roughly 40% of Americans who use the Internet, a population that is substantially different from the U.S. population at-large.
Recognizing the limitations of self-selected samples, some polling organizations are adopting new approaches in an effort to create more reliable samples. Harris Black International, for example, collects email addresses from volunteers at various websites and later contacts them to participate in an online poll. The results are statistically adjusted to compensate for demographic differences between Internet users and the U.S. population at-large.
The Mixed-Mode Online Survey
As part of its pre-election polling, the Pew Research Center tested yet another approach. To see if online polling can be conducted in a way that reflects public opinion nationwide, the Center adopted a strategy to achieve more control over who gets to participate in Internet polls.
The approach, called a mixed-mode approach, has two phases. First, email addresses are collected from individuals who are called as part of randomly-selected, nationally-representative samples. For instance, during three telephone surveys in August and September, respondents who use the Internet were asked if they would participate in a future online survey and, if so, to provide their email address. Out of the 4,473 people interviewed by phone, 42% said they go online and 42% of these Internet users (786) provided email addresses for a future online poll.
In the second phase, a random sample of respondents is selected from this pool of email addresses. Respondents were sent an email invitation to participate in an online survey and given a link and instructions for going to the World Wide Web to complete the poll. The survey was placed on a page of the Pew Research Center’s website that was unavailable to routine visitors. Selected respondents entered their email addresses for verification purposes before beginning the survey, which also prevented respondents from taking the survey more than once. Those who did not complete the survey after four days were sent a follow-up email.
Of 471 people contacted to participate in the pre-election online survey, 167 people (35%) completed the survey during a six-day field period, from October 28 to November 2.1 Simultaneously, the Pew Research Center conducted a national telephone survey.
Both the online survey and telephone survey were based on registered voters and were nearly identical in their content (see topline).2 The two surveys included questions on interest in the election, intention to vote, the generic ballot concerning party preference in the elections and several queries about factors that might influence their votes. Each survey also included approval questions for the president and Republican leaders in Congress and a question about impeachment.
The two surveys did differ in a few ways. The telephone survey included a set of questions that was not included in the online poll. The online survey, meanwhile, asked respondents questions about how often they go online for news and for election news. It also included an open-ended question about voting intentions.
Demographic Differences in Online Populations
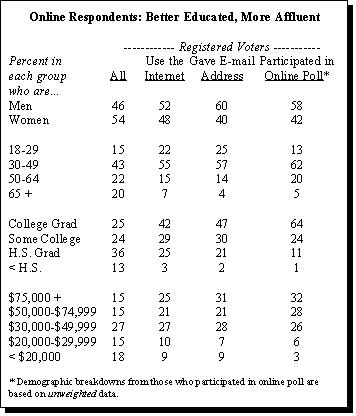
Despite the effort to draw a more representative, random sample, there are still substantial differences between the online respondents and those reached through national telephone surveys. These differences are reflected in a demographic comparison across a nationally-representative sample of all registered voters and four sequential sub-samples of this group — registered voters who use the Internet; those who use the Internet and agreed to participate in a future online survey; those who agreed to participate and responded to the online survey; and finally, those who agreed to participate but did not do so.
Compared to all registered voters, for example, the population of registered voters who go online is younger, better educated and more affluent.3 Fully 42% of them are college graduates, compared to just 25% of all registered voters. Similarly, just 22% of those in the online sample are age 50 or older, compared to 42% of all registered voters. Voters who use the Internet are also notably more affluent: 46% have family incomes more than $50,000 a year, compared to 30% of all registered voters.
The online sample also includes fewer women than the phone sample. While 54% of registered voters in the national telephone survey are women, just 48% of the online sample are women. Notably, just 40% of those who provided their email addresses for the online survey pool were women.
College graduates are over-represented in the online survey. Nearly two-thirds (64%) of the respondents are college graduates — more than twice as many as in the telephone sample of registered voters (25%). 4 The online sample also significantly over-represents those between ages 30 and 49. This group comprised 62% of the online sample, compared to 43% among all registered voters.
There are also political differences between the sample of all registered voters and the final sample from the online poll. Independents were disproportionately willing to provide their email addresses and to participate in the online survey. Consequently, fully 40% of the respondents in the online poll are Independents, compared to 29% of all registered voters. In contrast, just 27% of the online poll sample are Democrats, compared to 35% among all registered voters. There was not a significant difference in the Republican response rate.
To try to compensate for these demographic differences, the findings of the online survey were weighted — much as most national telephone surveys are weighted to compensate for the known under-representation of certain demographic groups. The online survey results were weighted by sex and education level, making the distribution of online respondents roughly comparable to that among all registered voters in the national telephone survey.
Comparing the Online and Telephone Surveys
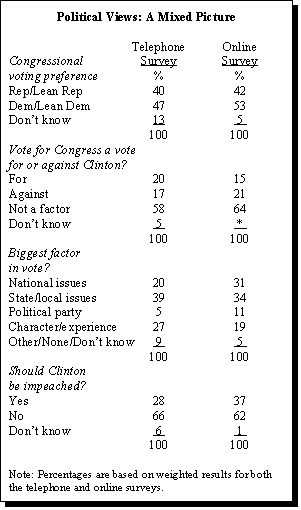
The results of the weighted online survey and the telephone survey are nearly identical on several questions measuring the chances respondents would vote on Election Day. The online poll also did a fairly good job estimating congressional voting preferences. But the online poll overstates interest in the election, support for impeaching Clinton, and the role of national issues as a factor in congressional voting.
In the online survey, 37% said Clinton should be impeached, compared to 28% of those in the telephone survey. But online respondents did not consistently express more conservative opinions than telephone respondents across all questions. For example, substantially more online respondents also disapproved of the way Republican leaders in Congress are handling their jobs (60% vs. 46%).
What’s more, registered voters in the two samples gave a slight edge to the Democrats when asked about their voting intentions in the race for Congress in their district. Online respondents favored the Democrats by an 11 percentage-point margin (53%-42%), while telephone respondents favored the Democrats by a narrower 7-point margin (47%-40%). Notably, these results from the Internet poll are comparable to those found in several other national telephone polls in the days before the election, as well.5
National issues were more important to online respondents than they were to telephone respondents, who expressed somewhat more concern about a candidate’s character or past experience. Some 31% of online respondents said national issues would make the biggest difference in their votes for Congress, compared to just 20% of telephone respondents. In contrast, 27% of those interviewed by phone said a candidate’s character and experience would be the most important factor, compared to 19% of those who took the online survey.
Despite the different attitudes toward impeachment, there is no statistically significant evidence that anger toward Clinton was a bigger factor among online respondents. For example, nearly equal numbers of online respondents and telephone respondents said their votes for Congress would be votes against Clinton (21% vs. 17%), and they differed little in how important a factor Clinton would be in their vote (64%, compared to 58%).
Internet Respondents: More Election Interest
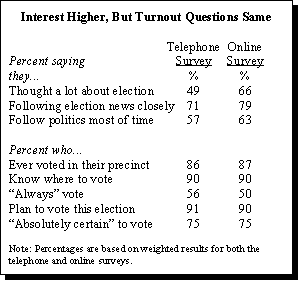
More online respondents than telephone respondents said they were thinking about the midterm elections. Fully two-thirds of online respondents (66%) said they had given “quite a lot” of thought to the election, compared to just half (49%) of telephone respondents.6 The differences are similar, although much smaller, on several other questions. Some 79% of online respondents said they were paying very or fairly close attention to news about the campaign, compared to 71% of telephone respondents. Among online respondents, 63% said they followed government and politics most of the time, compared to 57% of telephone respondents.7
Nonetheless, there were few differences between the two groups of registered voters when asked whether or not they planned to vote. Nearly all said they did — 90% in the online survey, 91% in the telephone survey. Three-quarters of both groups (75%) said they were absolutely certain to vote on Election Day, and both groups were equally likely to say they had voted in past elections and to know where people in their neighborhood go to vote. Asked to rate the chances they would vote on a scale from one to 10, 83% of online respondents rated themselves highly likely to vote, compared to 76% of telephone respondents.
Improvement Over Typical Internet Polls
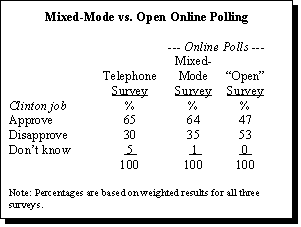
While there are certain political differences between respondents in telephone and online surveys, comparison with a less-controlled online poll suggests the mixed-mode approach does represent a step in the right direction. A third online questionnaire was also available to all visitors to the Pew Research Center’s website at the same time the pre-election polls were conducted. But unlike the national telephone survey and the mixed-mode online survey, in which respondents were selected to participate, this third poll was open to anyone who visited the Center’s website. As with the polls on many commercial websites, people could choose for themselves whether or not to participate.
Comparing the three polls reveals a familiar pattern: Respondents in the self-selecting poll were significantly more critical of Clinton. In both the telephone and mixed-mode online surveys, nearly two-thirds of the respondents (65% and 64%, respectively) approved of the way Clinton was handling his job. In contrast, respondents in the self-selecting survey disapproved of Clinton by a 53%-47% margin.8

